Ah, the rise of the machines! We’re not talking about a Terminator-style takeover but rather the incredible potential of GPTs (Generative Pre-trained Transformer) in software development. Think of GPTs as autocomplete on steroids; it’s all about finding the sweet spot in its vast web of word associations to achieve the best results. Though a GPT isn’t creative, it can help us solve already-solved problems, summarize information, and organize our thoughts. But be warned – without proper constraints, a GPT fills in blanks in context and spits out the next most statistically probable word. We humans call this “bullshitting.” Let’s dive into how we can optimize GPTs for software development without getting lost in the matrix.
Improving GPT Reliability
Utilizing GPT models can occasionally produce responses that do not directly address the posed questions. To enhance the dependability of a GPT’s output, certain straightforward methods can be employed. The following are some broad strategies to boost the reliability of GPT models:
Craft an explicit “system level” prompt: Consider setting the character you want ChatGPT to play. Doing so helps you maintain context and keeps the model on track.
Split complex tasks into simpler subtasks: Breaking down problems into smaller steps can significantly improve GPT’s problem-solving capabilities.
Prompt the model to explain before answering: This encourages the model to reason out its answers and helps you understand its thought process.
Prime the pump: Show the model examples of what you want it to achieve. This technique is called “few-shot” learning and helps the model follow a specific logic chain.
Prevent hallucination: If GPT produces gibberish, ask it to answer as truthfully as possible.
Ask for justifications and synthesize: Request multiple answers with their justifications, then synthesize them to find the most appropriate solution.
Generate many outputs and let the model pick the best one: This enables you to choose from various options and increases the likelihood of finding the ideal solution.
System Level Prompts
System level prompts are one way to set up the kind of output you expect a GPT to give back to you. Such prompts set the “character” you want ChatGPT to “play”. If the model starts to “hallucinate” (ie break character), you may need to re-enter this prompt. Future OpenAI interfaces will have a separate UI and “memory bank” for this prompt. For a comprehensive list of prompts, visit Awesome ChatGPT Prompts. Here is an example of a FullStack system level prompt:
“I want you to act as a software developer. I will provide some specific information about app requirements, and it will be your job to come up with an architecture and code for developing a secure app with Golang and Angular. My first request is ‘I want a system that allows users to register and save their vehicle information according to their roles, and there will be admin, user, and company roles. I want the system to use JWT for security’.”
Split complex tasks into more straightforward tasks
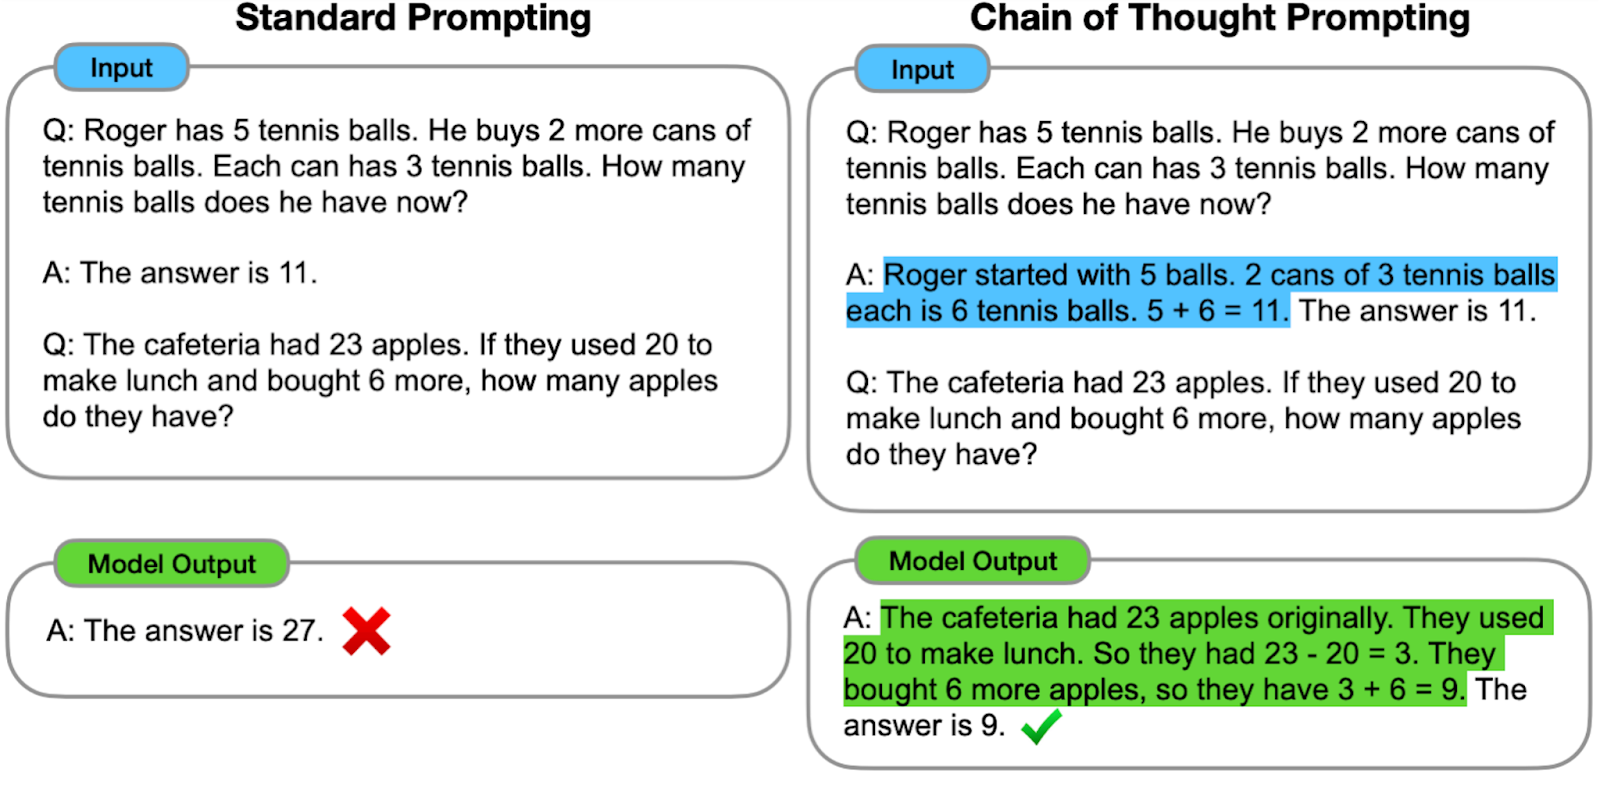
Breaking complex tasks into simpler subtasks can significantly improve GPT’s problem-solving abilities. For example, “let’s think step by step” alone can raise GPT-3’s solve rate on math/logic questions from 18% to 79%! (see: https://github.com/openai/openai-cookbook/blob/main/techniques_to_improve_reliability.md) You can also break down the problem into steps yourself, such as when asking for a bubble sort algorithm, by listing each action required.
Prime the Pump
Encourage the model to reason out its answers by providing a few examples (‘few-shot learning’). This helps the model follow specific logic chains, increasing the likelihood of accurate results. For various logic chain styles, check out:
When we say a GPT is “hallucinating,” we mean the model is returning results that are unrelated to our query, or even outright wrong or harmful. Not foolproof, but if you’re getting a ton of gibberish, here’s a quick technique you can try out. First, prompt the GPT to ask you for more information it needs to produce the best result. It can be as simple as “You will let me know if you need any additional inputs to perform this task.” Answer the question as truthfully as possible, and if you’re unsure of the answer, say “Sorry, I don’t know.” Several rounds of this type of questioning can often provide the model with enough context to start providing more relevant output.
Errors and Debugging
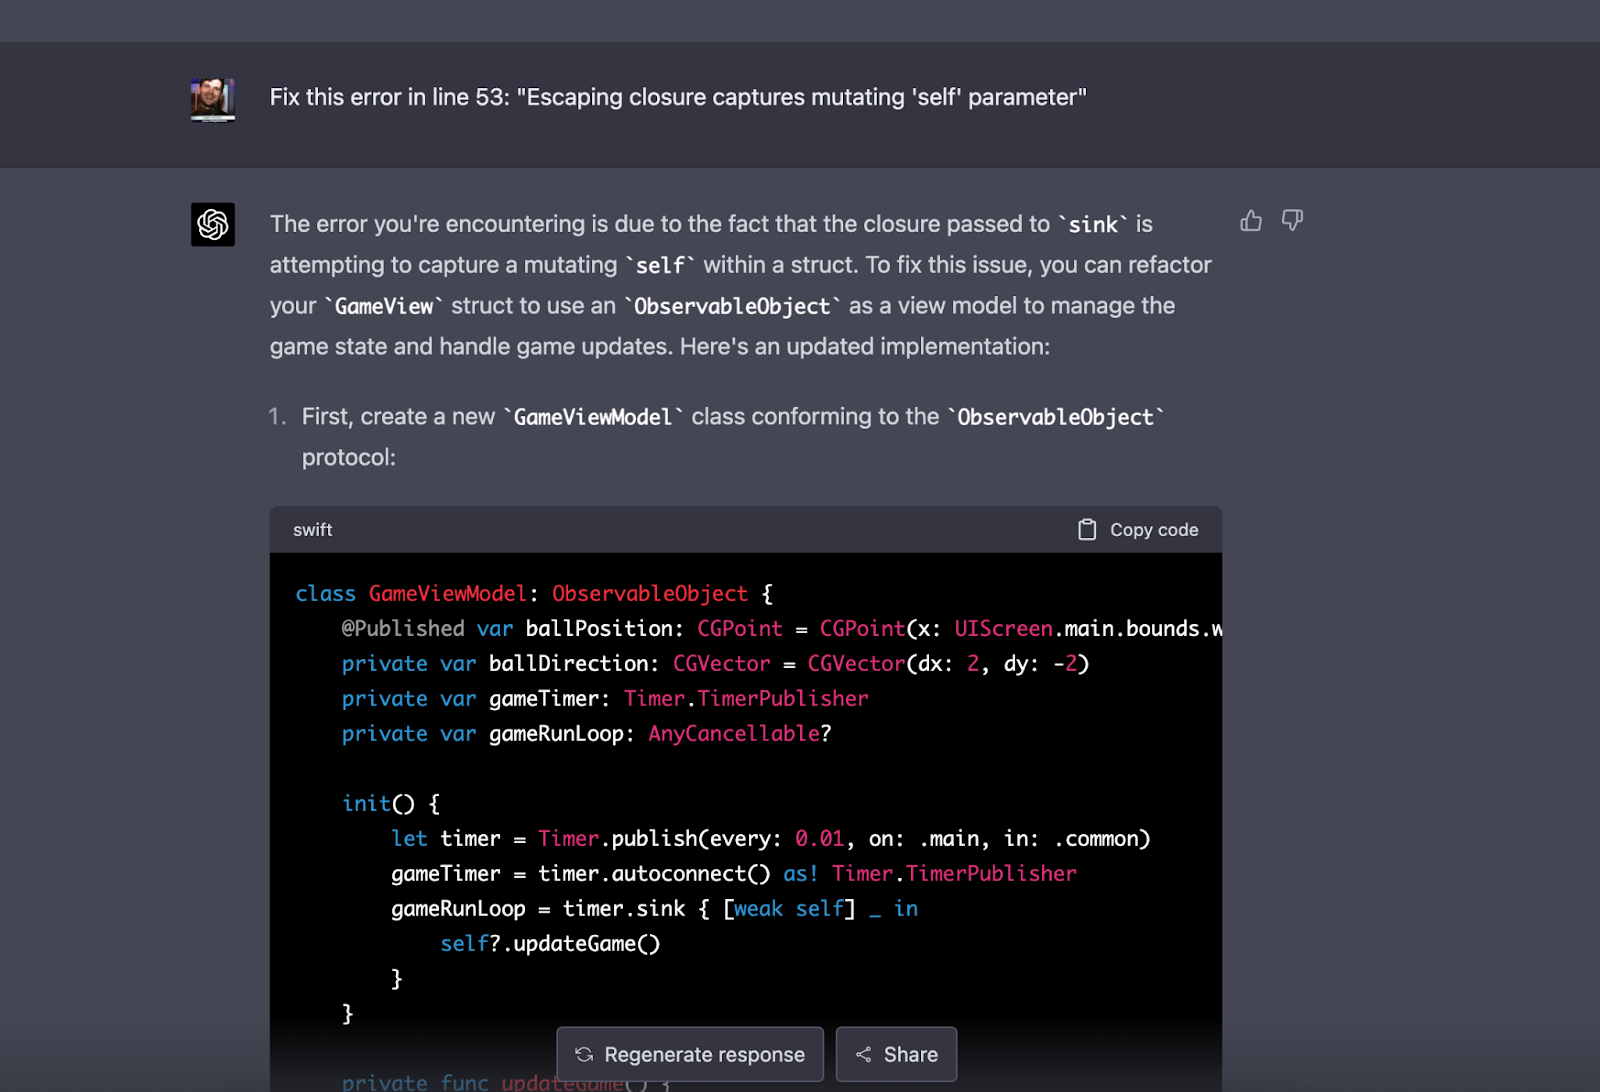
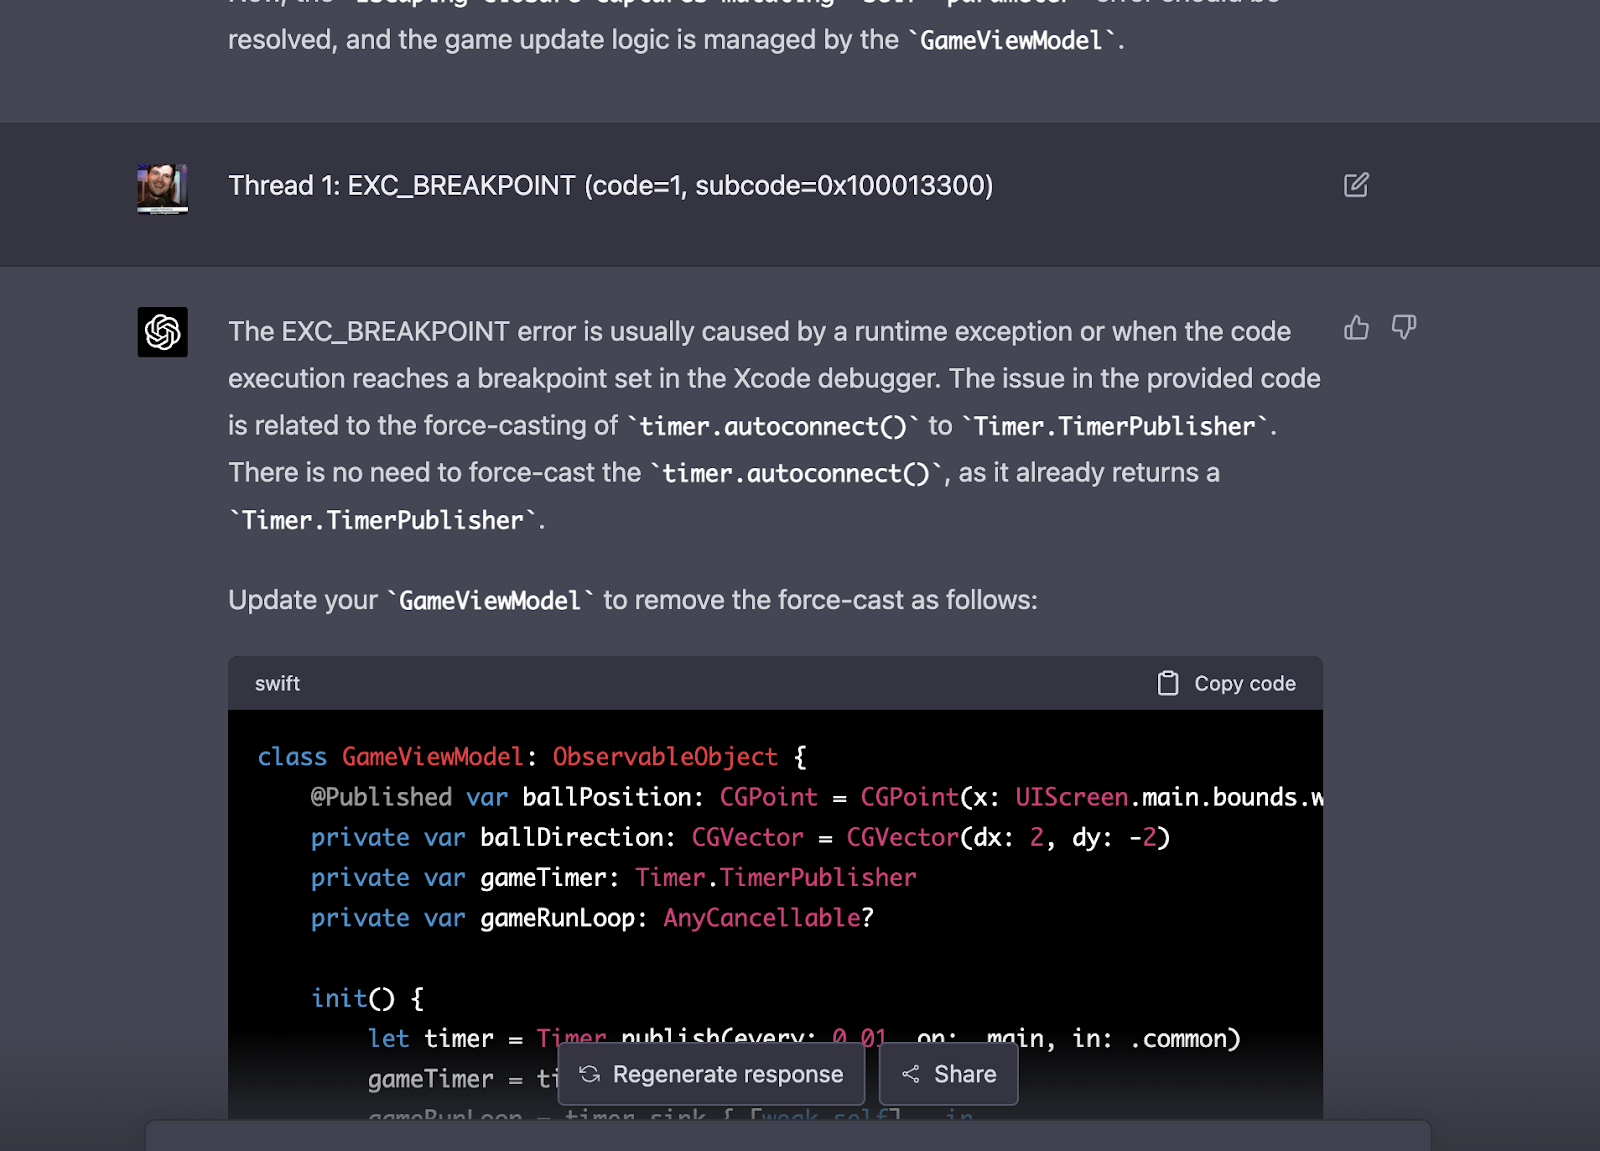
Often code generated by GPTs have errors you must debug. The models are synthesizing many code examples from different years, leveraging different library versions, and combining idioms that may be incompatible. That’s okay because GPTs can help you solve these bugs as easily as it creates them. If you’ve given a good system-level prompt, the GPT model may just need the literal error. Just copy-paste and pop it in. More context can help, though:
Share the relevant code snippet or line number
Explain your expected outcome after resolving the error.
Are there any specific improvements you’re looking for, such as performance or code readability?
Example of specifying a line number:
Example of inputting a compilation error directly into the prompt:
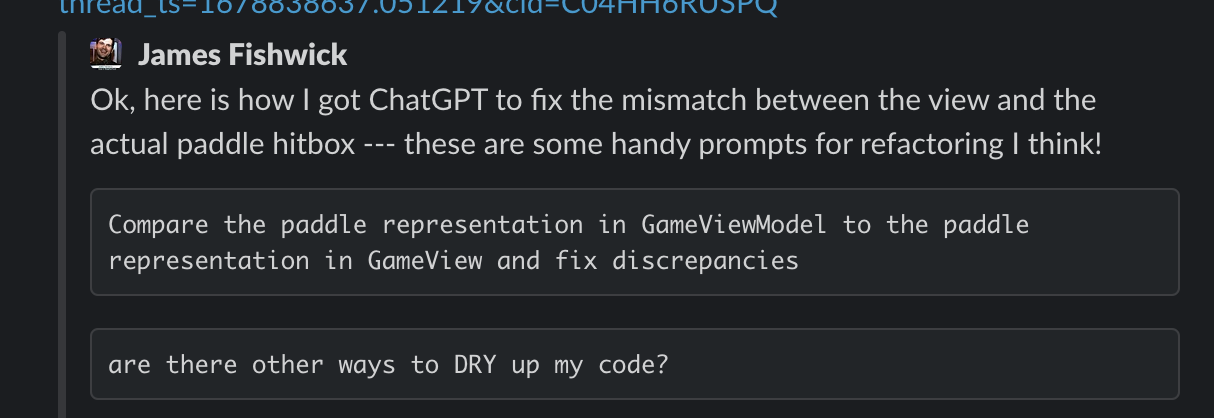
Views
One of the most common errors I’ve observed are bugs resulting from View code swerving away from ViewModel code. ChatGPT can compare snippets and help you centralize representations to share across the two.
ChatGPT vs. Copilot
At this point you may be wondering: “How does ChatGPT compare to GitHub’s Copilot released last year? Which should I use?” Copilot is capable of doing much of what ChatGPT does because they are based on the same model. Deciding between the two is largely a matter of what UI you prefer. I found it easier to use ChatGPT to generate the code in the first place, and a better place to interrogate the model about errors or get an explanation about what the model is doing. Copilot was nicer for modifying and extending existing code in the manner of a modern IDE.
Both ChatGPT and Copilot are based on modified GPT-3 models, making them technically similar. Both are trained on the same Github data set.
For creating one-off utilities and functions in unfamiliar languages, both are equally effective. To use ChatGPT, provide a prompt with the task, and for Copilot, create a new file with comments describing the desired behavior.
Once Copilot becomes familiar with your codebase, it’s invaluable, adapting to your style and suggestions, improving productivity, and easing refactoring.
For inspiration or exploratory work, ChatGPT is more flexible, as it allows you to discuss dislikes, and changes, and even receive opinions on the proposed solutions, while Copilot’s suggestions tend to be repetitive with minor variations.
Copilot
Copilot excels at performing source-to-source translations similar to ChatGPT, such as ingesting a schema through a comment embedding and using it to generate code. Additionally, it can provide explanations or step-by-step instructions to tackle specific problems.
/**
* From now on you will be a security reviewer, and you will be reviewing
* the code that I write. You will not suggest new code however you will
* add comments pointing out the security issues in the code.
*/
function renderHtml(input) {
	// This is a security issue, because the input is not sanitized
	markdown.renderHtml(input);
}
As Copilot is essentially a GPT-3 model, you can utilize inline prompts to engage in a more interactive Q&A style. Since it can only generate limited fragments at a time, you can use a space or newline to let it continue completing the response. For instance, if you have a question about the code, start with a comment prefixed by ‘Q:’ to ask the question. On the next line, add ‘A:’ on the next line and allow the AI to auto-fill the answer. Afterward, use a space or newline to prompt the AI to continue elaborating on the explanation. (I tip my hat to my colleague Nish Tahir for his coaching on leveraging Copilot in this way)
// Q: Why do we need to clone the node here?
// A: Because we need to mutate the node,
// but we can't mutate the node
// because we're borrowing it immutably.
// So we clone it, mutate the
// clone, and then return the clone.
let args_exp: SingleExpression = self.visit_argument_expression(node_as_args);
let mut args_exp: ArgumentsExpression * args_exp.as_arguments(J.unwrap(). clone();
Test Case Generation
Not only can ChatGPT generate app code, but it is also great for test case generation. For test cases, start by providing a brief introduction to your application, its components, and the requirements. Favor a “few shot” or “priming” approach here, giving the model as many examples of successful tests as possible. You can then ask ChatGPT for test case suggestions, test data ideas, or other testing-related insights. After that:
Describe the function for which you’d like to generate test cases, including its purpose, input parameters, and expected output.
Share the code snippet of the function.
Add specific test case requirements or edge cases you want to focus on.
Code Refactoring
It won’t take long to notice how literal Chat-GPT is, especially when you are optimizing features or classes in isolation. Producing concise, DRY code is another great use of ChatGPT, but it is a task best performed in a separate loop after your app works.
In your prompt, provide the following:
The code snippet or section that you would like to refactor.
The main goals for refactoring this code. For example, are you looking to improve performance, readability, maintainability, or adhere to best practices?
Any specific context or background information that may help in understanding the purpose of the code, such as the overall project, dependencies, or performance constraints
Making an Arkanoid Clone in SwiftUI
A couple weeks ago I decided to put ChatGPT 4 through its paces, and build an iOS app from scratch using SwiftUI. I have never written a line of swift in my life, and I don’t use an iPhone. To my surprise and delight, I was able to work with ChatGPT to spin up a serviceable Arkanoid clone in a few hours. Here is the initial system level prompt I used:
Act as an expert iOS developer and teacher. I will ask you to perform a development task, and you will explain how to accomplish it step by step. You will also instruct me on how to use Xcode properly to implement your solution and how to run it. Assume I have zero experience in this domain.
Your development task is to write an Arkanoid clone in SwiftUI. I want a start screen, and I should be able to control the paddle by touch.
It’s important to note that a GPT is not a silver bullet that will guide you towards best practices or a best-in-class solution. The code generated by a GPT is rough around the edges and requires expertise to polish and expand upon. A GPT simply autocompletes whatever the average of the internet is, with a preference towards what has the most documentation. This means that while it can be incredibly useful, it should not be relied on as the sole source of information.
Conclusion
GPT models are an incredibly powerful tool for software developers when used effectively. By following the techniques outlined above, you can harness GPT’s capabilities to accelerate your software development process and produce more accurate and reliable results. Dive in and experience the transformative potential of GPT for yourself!
James is a Senior Engineering Director at WillowTree. He’s seen things you people wouldn’t believe. Attack ships on fire off the shoulder of Orion. He’s watched C-beams glitter in the dark near the Tannhäuser Gate. All those moments will be lost in time, like tears in rain.
The engineering community here at WillowTree, especially within the iOS practice, has been super excited about SwiftUI. It’s incredible how much power and flexibility it brings to our app development workflows. This blog post was created in conjunction with Will Ellis, who gave a wonderful talk showcasing the power of SwiftUI Button Styles. You can find a copy of the code here.
Here at WillowTree, developers often work hand in hand with the design team before implementing anything in an app. For example, when we create a component (buttons, icons, sliders, etc.), designers provide a design system that illustrates how they should look and be reused across an app. In addition, these designs can show how the components change based on their state. In this blog post, we’ll be looking to implement buttons based on the designs below. Luckily, SwiftUI has great features that allow us to support different states for our buttons and make it easy to bring our designs to reality.
Option 1: Applying View Modifiers to Style a Button
SwiftUI already has a built-in Button component. Slap some view modifiers on that for styling, and boom, a button!
With just a few view modifiers, it is easy to get started. However, as it is currently written, the styling is not encapsulated or reusable.
// Applying view modifiers to style a button // Pros: // ✅ Easy to get started // // Cons: // ❌ Styling is not encapsulated or reusable, not DRY
Option 2: Wrapping Button with our own View
Another approach we can try is to create a custom button. To do this, we can give the custom button all the necessary view modifiers, and use initializers to pass in the action and label parameters.
This approach gets the job done, but it doesn’t allow us to access the button’s state and requires too much boilerplate code. We can do better than this.
// Wrapping Button with our own view // Pros: // ✅ Encapsulated, reusable, and DRY styling // // Cons: // ❌ Tight coupling of styling and content // ❌ No access to button pressed state // ❌ Have to duplicate Button boilerplate (e.g., // initializers, generic Label type)
Option 3: Using Built-in ButtonStyles
What if we wanted to use the built-in Button but also wanted to use Apple’s styling? This is where the .buttonStyle view modifier is useful. It has a variety of styling options from Apple that are pretty neat. It also gives us the option to set a role like .destructive that changes how the button functions.
The main downside is that it uses Apple’s styling designs, rather than our own designs, which takes away from the customization of an element.
// Apple provides us with built-in ButtonStyles // Pros: // ✅ Work cross-platform // ✅ Easy to use right out of the box // // Cons: // ❌ Not what’s in our design
Option 4: Creating a Custom ButtonStyle
Apple has also given us the option of creating our own button style type. ButtonStyle is just a protocol, and all we need to do to conform our own type to it is to implement the protocol’s makeBody function. This is where we would also adjust all the view modifiers for the styling we want. The really neat thing about this option is that we now have access to the .isPressed functionality which allows us to modify how the button reacts to being pressed. For example, we can change the background color while the button is pressed.
// Pros: // ✅ Encapsulated, reusable, and DRY styling // ✅ Access to button pressed state // ✅ Styling and content are decoupled // ✅ Can use existing button initializers // // Cons: // ❌ Easy. Almost too easy 🤨
We can then go further with a customized ButtonStyle by setting a color scheme based on our designs, using the environment value .isEnabled, creating a State variable for isHovered, etc. All these options allow us to manipulate how the button looks and feels within the app while maintaining the design we want, in an encapsulated, reusable way.
This option also makes it easy to set the desired color scheme just by extending ButtonStyle and initializing the different color scheme combinations. We can even extend our ButtonStyle to add leading and trailing icons using generics. Be sure to check out CapsuleButtonStyle in the repo to see how these variations are implemented.
Conclusion
Who knew buttons could be so fun? SwiftUI provides multiple options for customizing and styling buttons to match any design system. By exploring the different approaches, we gain a deeper understanding of the pros and cons of each option, so that we can make informed decisions about which approach is best for our particular use case. The iOS community here at WillowTree has enjoyed exploring all the cool things SwiftUI has to offer. Thanks for reading!
Will is a programmer who has been making iOS, web, embedded, and desktop software for many years. He loves to combine his skills in software engineering and his enthusiasm for HCI to make compelling, user-focused software.
Making technology understandable for any audience is why I first got into software testing and UX design. After having spent three decades learning how to explain technical things to people across a wide range of demographics, I’ve noticed this is an underdeveloped skill in our industry. It should be taught and emphasized so much more because when it is practiced and honed, it takes all of your other skills to the next level.
If you own a smartphone, reader, tablet, gaming console, desktop, flat screen, streaming service, home assistant, smart appliance, or garage door opener, you have no choice but to be able to converse about technology without getting frustrated. To be able to make some specific analogies and tips in this article, I’ll narrow the technical context down to roles and tasks most commonly found in a software development company. This would include everyone from project manager and designers to developers and testers.
That said, even with a warm audience of people and topics within your own company or industry, technical explanations are tough.
There are a lot of technical conversations in the day-to-day of software development, and most of them fall under one of these scenarios:
Peer-to-peer Knowledge transfer
Client demos
Executive presentations
Impromptu situations
No matter the situation you will use two tools: Willingness and Preparation.
Willingness
You may lack the self-confidence to explain technology, but the cool thing is, explaining technical things to anyone, friend, family, tech support, gradually improves your confidence. All you have to do is be willing to try and accept constructive feedback.
Volunteer for low-pressure opportunities to practice your preparation and explanation skills. When I’ve lacked confidence for an upcoming presentation I’ve run it by a peer or mentor to get feedback. It’s not only encouraging but the feedback can root out any holes or confusion before you go live.
Whether it’s a one-to-one conversation, a presentation to execs, or a Zoom meeting, remember, you have been asked or accepted to present on something you know, not for the things you don’t know (unless it’s a presentation on “Things We Don’t Know”).
By volunteering for low pressure opportunities, you’ll be able to hone your abilities in low stakes areas, and pretty soon you might even find your confidence has grown such that those areas that used to feel overwhelming might be just a bit easier to jump into.
Preparation
Even for impromptu situations, you can do preparation because, in actuality, you are preparing with every interaction you have at work because the core of preparation is communication.
Communication
“Explaining” and “presenting” are forms of communication. What I’m talking about is honing the art of communication. For example, if you have a potluck, there will probably be multiple forms of mac and cheese and they are all accepted on their own merit. But, if you have a mac and cheese cookoff, you focus on the nuances that elevate one mac and cheese over the other; you hone the art of mac and cheese.
One aspect of communication you can practice in almost every situation is clarifying terminology. Across roles, platforms, and demographics, the meaning of technical terms varies greatly but we all assume everyone is talking about the same thing.
Actively listen in conversations for words that are used interchangeably. If appropriate, ask one of the contributors what the term they used means to them. Many times I’ve done this and it reveals we are not all talking about the same thing or there are deeper nuances we’re missing.
When you agree on what you’re all talking about, then openly agree on which term all of you will use in the future. Then, be consistent. Make sure you use that term in documents, emails, and instant messaging. Even with clients and co-workers outside your project.
On the FOX Weather project, we had some development requirements around what happens when the app is closed or opened. We determined these two terms weren’t enough to explain all the scenarios.
We expanded “closed” to when a user puts an app “in the background” but it is still running, or, when the user “force quits” an app so that it is no longer running. One action might keep the user logged into their account where the other would log them out.
When a user taps an app’s icon on the home screen it “opens” but from two different states. If the app is “running in the background” the user is simply bringing the app back into the foreground and, potentially, continuing in the app where they left off. If the app was “force quit” the user is relaunching the app which might mean they have to login again.
Having the team agree on what these terms actually meant helped the project as a whole function better. All thanks to our shared communication.
Awareness
Saying, “just be willing to try” is a little trite, but the meaning behind it is that you are in situations where you have to explain tech all the time, you just need to become more aware of them. Be aware of the terms the listener is using; the points where comprehension sinks in and where it doesn’t. Then use that information to improve and take on more situations for practice.
Rhonda Oglesby has been with Willowtree since December 2019. Her career path as a software developer and designer led her to the perfect career: Senior Software Test Engineer. She’s a well-rounded geek who believes communication and conviction are the keys to success.
Imagine for a moment that you’ve been working tirelessly for months on a shiny new product with killer features. This one product alone will drive a 20% revenue bump in the year following launch. You’ve written maintainable code, great unit tests, and have an automated deploy pipeline that makes rapid iteration a joy. The product launches. People are installing the app. Active user count is climbing fast. 1-star reviews are flooding in…wait, what? “I can’t log in,” “all I see are 504 timeouts,” “trash doesn’t work,” ….oh dear. You didn’t do your capacity planning.
Disambiguation of Terms
The term “performance testing” tends to be used as a sort of catch-all; but really, it should be broken down into a few distinct categories. You can name the categories whatever you want, but for this article we’ll be using the definitions below:
Performance testing
You are measuring ‘how does this thing perform, under various specific circumstances.’ Can be thought of as “metric sampling.”
Stress testing
You are measuring ‘how does this thing respond to more load than it can handle,’ and ‘how does it recover.’ Can be thought of as “resiliency testing” or “failure testing.”
Load testing
You are measuring ‘given a specified amount of load, is the response acceptable?’ Can be thought of as a “unit test.”
Given the above definitions, you may note that a “stress test” is in fact a “performance test,” simply executed at unreasonable load levels. Similarly, a “load test” can be a composition of the other two, with the additional step of asserting a pass or fail.
Prerequisites
What do you need in order to perform these kinds of tests? The answer will of course vary (significantly) from case to case. We can, however, make generalizations about what is needed for the vast majority, especially given our end goal of capacity planning.
Production-Equivalent Infrastructure
The first step is to ensure that the environment you are performance testing against is provisioned the same as production. Same instance class, same storage amounts, same everything. This also includes any dependencies of your application, such as databases or other services. This is the most important prerequisite. Testing on your laptop or your under-provisioned QA environment may give you directional information, however it IS NOT acceptable nor sufficient to make capacity planning decisions.
Testing Tools
It is usually a good idea to use tools which make it simple and easy to record and version control your test cases. For instance, the tool Locust uses test cases which are simply Python classes; this is perfect for code review, and allows for rapid and simple customization of the tests (ex. Randomize a string without reuse). In contrast, JMeter uses an XML format which is significantly more difficult to code review, and generally must be edited from within its own GUI tool. Whatever tool you choose should be quick/easy to set up and provision. We want our effort to be on the testing, not fighting the tools.
Distributed Tracing
Distributed tracing allows you to ‘follow’ an event throughout your system, even across different services, and view metrics about each step along the way. Distributed tracing is strongly recommended, as it will enable you to simply review the data after your test, and rapidly zero in on problem areas without needing additional diagnostic steps. It may even help you uncover defects that you otherwise would not have noticed such as repeated/accidental calls to dependencies.
Achievable, Concrete Goal
As a group, you must come up with a goal for the system to adhere to. This goal should be expressed as a number of requests per time unit. You may additionally wish to include an acceptable failure rate as well; for example 5000 requests per second, <=2% failure rate. The business MUST be able to articulate what success looks like. That 20% revenue projection? That came from something tangible. Active users performing specific tasks over time. Non-technical stakeholders may balk at being asked to provide concrete non-revenue numbers. It’s important to partner with these individuals and help them understand where the revenue goal comes from, and how these concrete numbers impact the likelihood of success.
Revenue is effectively the ANSWER to a complex math problem with multiple input variables; we must reverse-engineer the equation to solve for one of those inputs. If that 20% revenue projection is based on nothing but hopes and dreams then just do something reasonable. More on this in the Partner section below.
Methodology
So, how do we go about doing all of this? Instrument, Provision, Explore, Extrapolate, Partner, Assess, Correct. IPEEPAC! This acronym is my contribution to our industry’s collection of awful buzzwords. You are quite welcome.
Instrument
We can begin with instrumenting the application. The specifics of how to do this with any given framework/vendor could be an entire article by itself, so for our purposes we’ll stick with some fairly agnostic terminology and general approaches. You’ll need to identify a vendor/product which supports your tech stack and follow their instructions for actually getting it online. They will likely use the terms below, or something similar.
Span
An ‘individual operation’ to be measured
Spans can, well, span multiple physical operations; for example a span could be a function call, which actually makes several API calls
Can be automatically generated or user-defined
May have many attributes, but typically we care about the elapsed time
Can contain other spans
Trace
An end-to-end collection of spans
The complete picture of everything that went on from the moment a request enters the application until the response is transmitted and the trace is closed
Here’s an example visualization of a trace and it’s associated spans, taken from the Jaeger documentation:
It’s evident why this is useful. We see every operation performed for the given request, how long it took, and even if things are happening in series or in parallel. We could even see what queries are being executed against the database, as long as the tooling supports it.
Most instrumentation tools will provide you with some form of auto-instrumentation out of the box. Whether it’s an agent which hijacks the JVM, or a regular SDK that you bootstrap into your application at startup. Many times, this will be sufficient for our purposes but always verify that this is the case. At a minimum, we need to ensure that we are getting the overall trace and spans for every individual dependency; be it http, sql, smtp, or what have you. This is enough to give us a rough idea of where problems lie. Mostly, it will help us to identify if the source of slowdown is our application code, some dependency call, or a combination thereof.
Ideally we would want some finer grained detail. It’s typically good to add spans, or enrich existing ones with contextual information. For instance, you have a nested loop making api calls – it would be good to have a span encompassing just this so that you can easily see how much execution time it takes up without needing to sum up the dependencies. You could add metadata to that span about the request – perhaps certain parameters are yielding a much larger list to iterate over.
Provision
This one is straightforward; creation of your compute and/or other resources – be they cloud or on-prem. Provision your production analog, and your test tooling. Verify that the tooling works as expected and is able to reach the application under test.
Importantly, DISABLE any WAF, bot detection, rate limiting, etc. These are vital for an actual production environment, but will make our testing difficult or impossible. Remember what we are testing here – it’s our application and architecture, not your cloud vendor’s fancy AI intrusion detection.
Explore
This is where the party starts. For right now, disable autoscaling and lock yourself to a single instance of the application. We’ll get back to this, but in the meantime, let’s start crafting some test cases. This is a lot of art mixed into the science unfortunately…We want to be as thorough as possible. Ideally, we would like to exercise every operation the application may perform, however, this isn’t always feasible. There may be too many permutations, or some operations may require proper sequencing in order to execute at all…so what to do?
Start by separating the application into its different resources, and their possible operations. Be sure to include prerequisites such as user profiles. For example, you can fetch or update a single user’s profile or search for multiple profiles…but you can’t really do any of that until a user has been registered, because the registration process creates the profile.
So:
Register user <randomized guid + searchable tag>
Fetch profile <id>
Search profiles matching <tag>
Update profile <id>
We could have a test that does exactly that sequence of events. While this does exercise the code, it’s somewhat conflating issues and also misses some points.
This exercises a large number of users registering/viewing/updating their profiles at once
The longer the test runs, the larger the list of profiles that will be found/returned for the tag search
Let’s try again:
Register user
Fetch profile
Update profile
Search profiles
fetch a subset of these individually
This more closely resembles what actual traffic would look like. People generally register, go to their profile, then update it. Other users generally will search for stuff, and then view it. Taken together, this gives us a better picture of how our user experience will progress as we add more users to the system.
However, we’re still missing something. While we are exercising both read and update, we are doing so more or less sequentially. So we might want to add an additional, separate test:
Register n users
In parallel
Fetch individual profiles
Update individual profiles
Search by tag
Now, taken at face value this may not seem like a relevant test. Users do not generally update their profiles in a massively parallel manner. However, what this test does tell us is how our application responds to multiple, potentially conflicting, potentially LOCKING operations happening simultaneously.
If we apply this thinking to all the operations the application may perform, we could end up with an overwhelming number of test cases, but we can pare things down. We should identify the so-called ‘golden path’ of the application; the sequence of operations that most people perform most of the time. This should be a relatively small slice of functionality, spread across a few areas. We can be very thorough about exercising this functionality. Then, we use our knowledge of the application to identify other areas which we expect may be problematic, or areas that we simply don’t have any coverage on at all. This is where the art vs science really comes into play.
Once we have the test cases, we can start executing them. It is generally advisable to start small and increase relatively rapidly until you start seeing issues. A starting point might be to start at 10 operations/second and keep doubling until you see excessive slowdown or errors. Once you see this, dial it back to the last checkpoint and make small adjustments until you find the breaking point, or single-instance capacity. Note this down, it’s important. Also note down CPU and memory consumption at this point, as well as average and max response times for any dependency calls (you did implement tracing, right?).
A common question to have at this point is “what counts as excessive slowdown/errors.” Unfortunately, it’s really case-by-case. You could assume as a starting point that your 10 operations/second performance is ‘acceptable,’ and then once your response time or error rate doubles, then it is no longer acceptable. You could also assume that it’s fine until the ratio of failed requests to successful ones is greater than 50%. At this stage in the process, any of this is fine; we are exploring, after all. We’ll return to the topic later.
Extrapolate
Now that we’ve done some exploration, we can make some educated extrapolations. We have our single-instance capacity. We know that a high-availability application generally wants MINIMUM 3 instances, spread across availability zones…So we can extrapolate that this setup should handle 3x our single-instance capacity. So go and set that up. Re-run the exploration and record the results. Do they align with our extrapolation? If yes, great success. If not, we need to understand why and potentially make changes so that they DO align.
This is also a good time to do a stress test. Push those 3 instances until they become unresponsive, then back the traffic down to ‘reasonable’ levels and see how long they take to recover. Again, note it down.
It would be wise to take a look at the tracing data here. It will likely help you identify the reason for any discrepancy between our prediction and the actual results. Ex. more traffic being sent to particular instances, or increased latency on database queries because the database is in a different availability zone than two of the instances.
Partner
Now that we have some baseline data, we need to figure out what to do with it. The business has revenue goals, and our product owner almost certainly knows what an acceptable user experience “feels” like even if they can’t (yet) articulate numbers. This is a good time to get the product owner (or other relevant stakeholders) involved in the process.
Start by sharing the baseline, 10 requests/second numbers. Show how the application responds here; people will usually have opinions of if this “feels okay” or not.
If not, we have a major problem
Next we need to determine how slow is too slow, and/or how many errors is too many
We can start by sharing our exploration assumptions – everyone may be fine with it
This can be challenging – if possible it would be good to mock up the application so you can configure a delay
Can also relate to other activities – “it loads before you finish reaching for the coffee, or “you can take a long swig and put the cup down.”
Once we know what is acceptable vs not, we can configure autoscaling accordingly
It needs to kick in well BEFORE we hit the “unacceptable” mark
Remember that it can take tens of seconds to a few minutes for new instances to come online, depending on your hosting choices
A fair starting point is to set your scaling to about 65% of “unacceptable”; you can tweak this higher or lower as needed
Now the truly difficult part begins – working with the stakeholders to determine how many requests per second do we need to be able to handle. Quite frequently the first answer is “all of them”. We know this is not possible; the cloud is not magic, and even if it was, the price tag would far exceed the revenue goal.
We can start with what we do know. Our “golden path” defines certain operations, and we know how many requests those need, and how long they take. We can get a ballpark requests/second for a single user based on this count, over some amount of time.
Next we need to know how many active users to expect. This is going to be entirely case-by-case. We may be able to do relatively simple math in the vein of “x transactions at y, average user makes z transactions in a week”…or perhaps we have traffic levels for an existing product, and the business projects “n” times that much traffic. Reality is seldom so simple.
Most likely we’ll need to really get deep into the business case for the product, how the revenue goal is determined, and derive some way to associate this to a number of simultaneous users. It’s very important to do this in collaboration with the stakeholders so that everyone shares ownership of this estimate. The goal is not to point fingers at so-and-so making bad estimates, but to make a good estimate and to learn from any mistakes together. Going through this exercise may even help the business to make better, more informed goals in the future.
Given an average user’s requests/second and our estimated active user count, the simplest solution is to multiply them. In theory this should give us our projected “sustained load” (depending on the application, we may also need to identify the acute load, or the load when experiencing peak traffic. For instance, we expect a restaurant’s traffic to hugely spike for the lunchtime hour). Experience has shown that it is often prudent to double (or more than double) this number for launch, and then hopefully reign it in after the initial surge has died down. Once you obtain real-world average traffic you can set your minimum instance count to support that, and then set maximum to the greater of 2x the new minimum or 2x our original projection.
It is worth noting that the projected numbers may be very/too expensive to operate. Options are limited here:
Attempt optimization of the application
May or may not be possible/make a noticeable difference
Accept the cost
Don’t launch
Re-estimate – for instance, consider that not all time zones will be active at the same time
This is a huge risk, and should be avoided if at all possible. Any scrum team will tell you that “you need to size this smaller” rarely ends well
Phased rollout – launch to one geography or subset of users, make adjustments and projections based on the traffic seen there
Assess
This is an easy one…Execute tests at our expected load, and work it all the way up to maximum capacity. We want to see the autoscaling trigger and maintain acceptable performance. Document the results, and once again poke through the tracing looking for any anomalous behavior. We want to be sure to identify and document any potential issues at this point. For instance, a 3rd party dependency rate-limiting us before we hit maximum capacity, or perhaps our database doesn’t have enough connection slots.
Correct
Based on the assessment, correct the issues and re-assess. If there’s anything that cannot be resolved, document that issue, and have the stakeholders sign off on it before launch.
Infrastructural Notes
It is important to recognize that your choice of hosting has a huge impact on both how scalable your application is, and how you must configure that scalability. For instance, a basic deployment into an autoscaling group may allow you to scale based on CPU consumption. An advanced Kubernetes deployment with custom metrics may allow you to scale based on the rate of inbound HTTP requests. Deploying into some cloud PaaS may be anywhere in between, depending on the vendor. Why does this matter?
Capacity is more than CPU+RAM
It cannot be assumed that high load ALWAYS corresponds to significant processor or memory utilization. It is a reasonable assumption for perhaps the majority of use cases, however it is certainly not a universal truth. If an application is primarily I/O bound, then it is possible to completely overwhelm it without significant processor or memory spikes. Consider the increasingly common middle-tier API. It simply makes calls to other APIs, and amalgamates them into a single response for the consumer. Most of its time is actually spent idle, waiting for responses from other applications. If its dependencies are slow, we could consume the entire threadpool with requests, and return 503/504 status codes without seeing a CPU spike. Ironically, if many of those responses were to complete all at once we might see a massive CPU spike, which could render our service entirely unresponsive, but also would be so brief as to not trigger a CPU scaling rule which typically requires a sustained load over a period of minutes.
Bandwidth must also be considered. Our CPU and RAM may fit nicely within the most basic instance class, but if the virtual NIC is insufficient for the amount of data we are dealing with, we will find ourselves bottlenecked and once again not scaling. Ditto for disk IOPS. The long and short of it is we must look holistically at the application’s workload, and EVERYTHING it needs to accomplish that workload when capacity planning.
A caution about serverless
There is nothing inherently wrong with serverless/lambda/etc as a hosting choice. There is, however, a fair bit wrong with assuming that it is always a GOOD solution to your scalability problems. Like any and all other tools, we need to understand how it works, what it is good at doing, and what problems it may actually introduce into the system. Serverless is perhaps one of the most frequently misunderstood and/or misused hosting options, especially when it comes to REST APIs.
Serverless typically operates by creating a new instance of your application for every inbound request; assuming all current instances are processing their own requests. This gives the application massive horizontal scalability, and parallel processing capacity, but has some limitations.
Cold starts
Literally booting a new instance of your application for every request introduces latency; for instance, java/spring applications may take multiple seconds to start up
Many providers offer a service tier to reduce cold starts – at additional cost
Massive is not infinite
There IS an upper bound to the number of instances; AWS for example by default limits you to 1000 concurrent lambda executions per Region
So yes, your dev environment may be consuming execution ‘slots’ preventing production from operating at capacity
Larger serverless instances tend to be costly, and they may accrue cost both per invocation and for execution time
It can be difficult to get your application into a serverless platform
Vendor depending; there are often size limits for your executable or other restrictions which need to be worked around
The parallel nature of serverless can also introduce new problems.
Your database’s connection slots can rapidly be exhausted because every serverless instance will consume at least one slot; connection pooling code will only apply within each instance
Internal caching of dependency requests will only happen within each instance; increasing the number of calls to your dependencies
Backoff/retry logic will also only happen within each instance
The thing to note here is that simply hosting on serverless does not necessarily increase your capacity to handle inbound requests. In fact, the parallel nature of serverless may reduce capacity overall. To reap the benefits, not only must your application be designed with serverless in mind, but also your dependencies must be able to handle it as well.
Wrapping Up
Application performance and scalability is a huge and broad topic, and this article is really just hitting some of the highlights. While we’ve outlined a sort of methodology and a whole lot of steps and things to watch out for, you don’t have to do everything at once. Start small – if you can only do one thing, add the instrumentation.You might be surprised how much you learn. If you can do two things, instrument and partner with the stakeholders to work out what the goal should be.
WillowTree is an organization that has absolutely exploded with growth over the last 7 years, since I started here as an intern in 2016. At the time, we were at about 150 people in the entire company, and now we’re eclipsing 1,300. With this growth has obviously come change. Information is harder to disseminate, and it’s harder to be on the same page with your fellow engineers when you’re much more spread out. This sort of spread means we end up solving the same problem multiple times, and sometimes incorrectly. My colleague, Andrew Carter, said it best, “building an app is your game to lose.” We have all the tools and knowledge at our disposal with the great minds here within WT, so how do we make sure we’re making the most of them?
Building an app is your game to lose.
You hear it all the time in the industry; a company got big and lost its culture. But why? Is it that culture intrinsically cannot scale? Is it that hiring needs to become less specialized to fill a larger number of seats? I think the answer depends on the organization.
WillowTree’s engineering culture has always heavily emphasized the importance of growing our own engineers’ abilities. A focus on mentorship, combined with truly great people make this formula work very well, and you can see it in WillowTree’s success. Pre-2020, this culture was heavily dependent on colocation. When the Covid-19 pandemic pushed all of us to work from home, that was a big shift, and our special sauce needed to be adjusted a little.
We saw a lot of changes happening with this shift to working from home. A lot of the crosstalk that would naturally happen across project teams simply stopped because we were no longer sitting together. Folks that were hired after this point (see: the majority of the company) were coming in with no opportunity to share a physical space with coworkers. It became much easier to lose your identity as a WillowTree employee, and be pulled solely into your project work. In the short term this may seem great, no pesky distractions from delivering quality products on time, but in the long term this has negative implications for things like mentorship, individual growth, and in turn, project outcomes. These implications are then compounded further when you consider the massive growth we’d taken on in that time. With that growth, it become more important to maintain our ability to raise people up internally and make them the best versions of themselves.
This is where Andrew Carter and myself come in. Some very smart people before us identified that there was a need for a more centralized role; one that wouldn’t be billed to a client. A role that would exist as a conduit for folks to more easily share information across project teams, and in turn, across the org. That role has been dubbed “Practice Advisor,” with Andrew and myself being the first two to take it on, specializing in iOS and Android, respectively.
“So what the heck does a Practice Advisor do exactly?” Great question; we’ve spent the last few weeks working on that, and to be honest, we’re still figuring it out 😬. But really, our first steps are focused primarily on setting a baseline for ourselves and for the organization. What sort of things are our engineering teams struggling with currently? What are our current stumbling blocks? Are there mistakes we see getting made repeatedly across the org, or are we learning from our own teams? Do engineers have enough time to learn, grow, and be the best engineers they can be?
By maintaining our technical expertise, we can stay close to the engineers doing the work, but serve as liaisons to impact broader org changes.
We’ve been spending a lot of time tracking and advocating for people’s involvement in some existing WillowTree shenanigans. For example, we’ve been looking at GROW, which is a space for folks to come present something they think is cool, something their team had a tough time with, or just something they’d like people to know. This has been flourishing recently with an influx of folks coming from Andrew and I’s consistent berating informing. Our backlog of content now extends two months out, and attendance has never been higher with our most recent GROW having over 40% of each practice in attendance. Besides GROW, we’ve also started holding Office Hours. These are meant to be a space for anyone to come and either ask questions about mobile, or have larger group discussions around potentially-controversial topics in the space (viewmodels with SwiftUI anyone?).
Looking ahead we’re going to be meeting more closely with various levels of the organization to further spread awareness of the role while also garnering more information about people’s needs or wants from the role. Andrew and I are still in client services, it’s just that now the client is WillowTree itself! We’ll be posting additional journal entries like this as we continue to flesh out and evolve this role, so check back to stay informed about this role and the other engineering happenings here at WillowTree!
The best iOS developer in Staunton Virginia, and third best banjo player. Making apps @ WillowTree since 2011, he’s now focused on building our iOS practice.
Swift Snapshot Testing is a wonderful open source library that provides support for snapshot tests in your swift code. Its snapshot comparison options are robust, supporting UIImages, JSON, ViewControllers, and more. Originally developed with unit tests in mind, this tool is easily extended to support comparisons of `XCUIElement`s in UI tests as well. This allows for quick creation of automated tests that perform more robust visual validation than XCUI can provide out of the box.
Installing Swift Snapshot Testing
Installing involves two steps – importing the package and updating the dependency manager in your project to use the specified version.
Importing the Package (Xcode 13)
Go to File -> Add Packages
Click the plus and copy the Package Repository URL from the Snapshot Testing Installation Guide
Load the package
Select Dependency Rule and add to the project where the UI test targets live.
If the tests live in the same scheme as the application code, you’ll have to update the project settings as well. Even if they live in a different scheme, follow the steps below to ensure that the package is associated with the correct target.
Set the Package to the Correct Target
Go to Project Settings
Select Project and ensure that the SnapshotTesting package is displayed
Select the Application Target and ensure that the SnapshotTesting package is not displayed under Link Binary with Libraries
Example: You don’t want the package to be associated with the application target, in this case SnapshotTestingExample
Select the UI Test target and ensure the package is displayed under Link Binary with Libraries
Example: You do want the package associated with the UI test target in Project Settings, in this case SnapshotTestingExampleUITests
Using Swift Snapshot Testing
Working with snapshot testing is as simple as writing a typical test, storing an image, then asserting on that image. You’ll have to run the test twice – the first “fails” but records the reference snapshot, then the second actually validates the snapshot taken during the run matches that reference.
Writing a Snapshot Test
In the case of UI testing, without any custom extensions, you can assert on UIImages either on the screen as a whole, or on a specific element.
Snapshot the whole screen
// Using UIImage for comparing screenshots of the simulator screen view.
let app = XCUIApplication()
// Whole screen as displayed on the simulator
let snapshotScreen = app.windows.firstMatch.screenshot().image
assertSnapshot(matching: snapshotScreen, as: .image())
Tip – Set the simulator to a default time when using whole screen snapshots
A full screen snapshot includes the clock time, which can understandably cause issues. There is a simple script you can add to the pre-run scripts for tests in the project scheme that will force a simulator to a set time to work around this.
To Set a Default Time
Select the Scheme where the UI tests live
Go to Product -> Scheme -> Edit Scheme
Expand Test, and select Pre-Actions
Hit the + at the bottom to add a new script and copy the script below
Simulators set to specific time when running tests
Snapshot a specific element
// Using UIImage for comparing screenshots of XCUI Elements
// Specific element on the simulator screen
let snapshotElement = app.staticTexts[“article-blurb”].screenshot().image
assertSnapshot(matching: snapshotElement, as: .image(precision: 0.98, scale: nil))
If you instead utilize the custom extension that provides support for XCUIElements directly, as found in this pull request on the repo, the code is simplified a bit and removes the need to create a screenshot manually, as seen below.
// Using extension to support direct XCUIElement Snapshot comparison
let app = XCUIApplication()

// Whole screen as displayed on the simulator
let snapshotScreen = app.windows.firstMatch
assertSnapshot(matching: snapshotScreen, as: .image())

// Specific element on the simulator screen
let snapshotElement = app.staticTexts[“article-blurb”]
assertSnapshot(matching: snapshotElement, as: .image(precision: 0.98, scale: nil))
Precision and Tolerance
One of the features I appreciate in this framework is the ability to set a precision or tolerance for the snapshot tests. As seen in some of the above examples, the precision is passed in on the `assertSnapshot()` call.
// Precision example
assertSnapshot(matching: snapshotElement, as:. image(precision: 0.98, scale: nil))
Precision is an optional value that can be set between 0-1. It defaults to 1, which requires the snapshots to be a 100% match. With the above example the two can be a 98% match and still pass.
Tip – Image size matters
While it makes sense when you think about it, it may not be readily apparent that you need to have two images of the same height and width. If they differ in overall size, the assertion will fail immediately without doing the pixel by pixel comparison.
Tip – Device & machine matters
Snapshots need to be taken on the same device, os, scale and gamut as the one it will be run against. Different devices/os may have differences in color, and my team even saw issues where the same simulator, os, and xcode version had snapshots of a slightly different size when generated on two different developer machines of same make and model – but were different years and slightly different screen sizes.
Reference Snapshots
As mentioned, reference snapshots are recorded on the first run of the test. On subsequent runs, the reference snapshot will be used to compare against new runs. If the elements change, it is easy to update them.
Snapshot Reference Storage Location
The snapshot references are stored in a hidden `__Snapshots__` folder that lives in the same folder in which the snapshot assertion was called.
For example, if my file directory looks like this:
If the functions that call `assertSnapshot` live in the `BaseTest.swift` file, the `__Snapshots__` folder will also exist under `Tests`. The snapshots themselves are then sorted into folders based on the class that called them.
Example: Finder view of the folder structure showing a full screen snapshot taken from a test found in the BaseTest class.
The snapshots will be named according to a pattern, depending on if they are full screen or specific element snapshots:
Specific Element: <functionCallingAssertion>._<snapshotted element>.png
Full Screen: <functionCallingAssertion>.<#>.png
// Take snapshot of specific element
func snapshotElement() {
  let homeScreenLoginField = app.textFields[“login-field”]
  assertSnapshot(matching: homeScreenLoginField, as: .image())
}

// Take snapshot of whole screen
Func snapshotScreen() {
  let screenView = app.windows.firstMatch
  assertSnapshot(matching: screenView, as: .image())
}
Given the examples above, the file names resulting of each would be:
Specific Element: snapshotElement._homeScreenLoginField.png
Whole Screen: snapshotScreen.1.png
Update Snapshots
There are two ways to update snapshots with this tool – with a global flag or a parameterized flag.
// Pass in update parameter
assertSnapshot(matching: someXCUIElement, as: .image, record: true)

// global
isRecording = true
assertSnapshot(matching: someXCUIElement, as: .image)
For the project where we implemented snapshot testing, we utilized the global flag to allow for snapshots to be generated in CI; otherwise, we used the parameterized variant for updating specific test/device combinations.
Tip – Tests With Multiple Assertions
Consider carefully if you are thinking about having multiple snapshot assertions in a single test. This is not something I would recommend, largely based on the difficulty of updating the reference snapshots.
One hiccup we ran into with using snapshots was attempting to update them when a test had multiple `assertSnapshot()` calls. If you use the parameterized flag, the test will always stop at the first assertion where that flag is active to make the recording. Then you have to toggle it off, run it again for the next one and so on.
This behavior is worse if you use the global flag, as once it hits the first assertion it will stop the test to take the screenshot, and never continue to the other assertions.
Snapshots on multiple devices
With this framework, you can simulate multiple device types on a single simulator by default. However if you find the need to run a full suite of tests on multiple simulators, you’ll need to extend the code to provide a way to do that – otherwise any simulator aside from the one that the reference shots were taken on will fail.
Resolving this on our team was actually pretty easy – my teammate Josh Haines simply overloaded the `assertSnapshot()` call to pass in the device and OS versions to the end of the file name so that it always checks the snapshot associated with a specific device.
/// Overload of the `assertSnapshot` function included in `SnapshotTesting` library.
/// This will append the device name and OS version to the end of the generated images.
func assertSnapshot<Value, Format>(
  matching value: @autoclosure () throws -> Value,
  as snapshotting: Snapshotting<Value, Format>,
  named name: String? = nil,
  record recording: Bool = false,
  timeout: TimeInterval = 5,
  file: StaticString = #file,
  testName: String = #function,
  line: UInt = #line
  ) {
  // Name will either be "{name}-{deviceName}" or "{deviceName}" if name is nil.
  let device = UIDevice.current
  let deviceName = [device.name, device.systemName, device.systemVersion].joined(separator: " ")
  let name = name
    .map { $0 + "-\(deviceName)" }
    ?? "\(deviceName)"

  SnapshotTesting.assertSnapshot(
    matching: try value(),
    as: snapshotting,
    named: name,
    record: recording,
    timeout: timeout,
    file: file,
    testName: testName,
    line: line
  )
}
The end results of this is an updated file name based on the simulator it’s taken on: <functionCalling>._<snapshotElement>-<device name>-<OS version>.png
For example, something like `testSnapshotTesting._snapshotElement-iPad-Pro-12-9-inch-5th-generation-iOS-15-5.png`
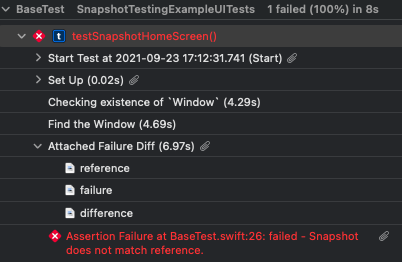
Triaging Failures
When a snapshot test fails, three snapshots are generated: reference, failure, and difference. Difference shows the reference and failure shots layered over the top of each other highlighting the areas where pixels differ. In order to see these snapshots, you need to dig into the Test Report and look at the entry right before the test failure message.
Viewing Snapshot Failures
In a local run, right click on the test that has failed and select `jump to report`. In a CI run, download and open the .xcresult file in Xcode.
Expand the test to see the execution details
Expand the “Attached Failure Diff” section (found right before the failure)
Example: Where to find the snapshots to triage for failures
When looking at the `difference` image, you’ll see the overlay of reference over failure to show where discrepancies are. It can be difficult to parse, but if you look at the example below, the white parts are roughly where the pixels differ while the matches are dark.
Example: The difference image showing the diff of the simulator clock
Check Swift Snapshot Testing’s GitHub repo, or get a tour of it from its creators in some unit tests at their website, pointfree.co.
Stephanie is a Staff Engineer and has worked in test for over 10 years on game, web, mobile, OTT and backend projects. In her spare time she likes to travel, teach, and write fiction. Since writing this post, Stephanie has taken another opportunity outside of WillowTree but the content here is too good to not share!
It’s a regular weekday afternoon and I’m sitting at my desk in the WillowTree Durham office. I’m enjoying some fancy dark chocolate peanut butter cups from the kitchen while working on my current React Native project. I’m a software engineer (SE).
If you’re reading this, you might be wondering how I got here. I started at WillowTree as a test engineer (TE) about two years ago and just recently transitioned to a developer role. In this article I’m going to talk about my transition from a TE to an SE and what I learned about switching roles.
Let’s rewind back to 2021. For a bit of background, I joined WillowTree as a test engineering intern during my senior year in college. I had switched majors a couple times and didn’t know exactlywhat career path I wanted to take, though I was pretty set on some sort of engineering track. One thing I liked about WillowTree was that personal development, growth, and career exploration are encouraged. After my internship, I joined full-time and focused on my TE skills for the first year or so. I really enjoyed being a TE, but eventually, I realized that what I really wanted to do was become a developer. Part of my motivation was that I like creating things, particularly if they look cool. So frontend development was especially attractive.
Now that you know a bit about me, let’s get started with the story! I can break my transition from TE to SE into 5 main sections – and stay tuned for some bonus notes at the end. (Disclaimer: I’m sure that everyone’s progress from one role into another varies widely, and this is by no means a standard guide – just my anecdote.)
Part 1: Getting close to the application code
Test engineers at WillowTree deal with lots of different types of tests, like UI, component, and unit tests to name a few. I think that any kind of test experience is helpful on the road to the developer track, but I personally found that writing tons of low-level unit and component tests helped the most. For me, learning how to unit test was a big part of learning how to develop, because I needed to understand how the code worked in order to test it well. As an intern, I worked on writing backend tests in Kotlin. Later, as I decided to focus on frontend, I switched to writing more tests using Jest and React Testing Library, which got me started with learning React.
As I was ramping up on my first project, I also got recommendations from my developer teammates for courses that could help me get familiar with the languages and tools used on our project. WillowTree provides a professional development budget, and I’m a big fan of platforms like Udemy or Frontend Masters, so I used my budget on courses through these sites. Other platforms recommended by engineers include Coursera and Laracasts (a webcast platform for learning web development). And if online courses aren’t your thing, additional tried-and-true methods include:
reading through official documentation and putting it into practice
reading professional development books (e.g. O’Reilly books)
following tutorials offered by the technology vendor
finding popular blog posts (e.g. Medium) or YouTube videos about the technology
Everyone’s learning style is different, so choose whatever resources work for you.
Image credit: Linus Tech Tips (via Tenor)
Part 2: Teaming up with the devs
As I started getting more comfortable with the languages and frameworks on my project, I wanted to try my hand at this developer business. The first step was letting my manager and teammates know that I was interested in picking up some development tickets, so they could offer me those opportunities. Then, I could 1) pick up low-hanging tickets on my own, or 2) pair with other engineers to work on bigger tasks. Pairing with other engineers in particular created a lot of learning opportunities, whether I was driving or just tagging along. After absorbing enough of their knowledge, I started taking ownership of developer tasks that had a more significant impact on the project – which was a great way to show skills and maybe even get some Lattice1 🥬 feedback.
Image credit: Walt Disney Productions
Part 3: Talking with mentors and showing off some side projects
Talking with my long term mentor (LTM)2 and my manager were hugely important during my transition. They provided some really valuable guidance on where I needed to focus my efforts to facilitate the transition to SE. Since I was aiming for a JavaScript developer role in particular, my focus was, well, JavaScript and React. Once I was feeling pretty good about those, I also started poking at neighboring tools like Node and Next.js.
Taking courses on relevant topics and completing tickets on my project was a good start, but I needed a way to show more skills outside of that. Enter side projects. One personal project that I used as evidence for my potential to be a developer was the Name Game. I hear the Name Game is usually part of the engineering interview, but since I hadn’t interviewed as an SE, this was news to me. When (after more than the two days allotted in the interview, I admit) I completed the Name Game, I had a project that I had built from scratch which showed a variety of engineering skills. It also provided more opportunities for… 🥬 feedback from my mentor (you may see a theme emerging here). I worked on a couple of other personal projects besides the Name Game during my upskilling period, and overall, I think they played a big part in my transition to a developer role.
Pro tip: if you work on a side project trying to learn a new skill, present that project to your LTM (or another engineer who is a pro at that skill) and ask for their feedback on how you can refactor or spice up your project for an extra challenge. I’ve found that everyone I reached out to, whether my actual mentor or other developers on my team, were more than happy to provide resources and guidance.
Part 4: Almost ready – scoring an unallocated role
Bear with me – we’ve been on this journey for a few months now but we’re getting close to the end (sort of, we still have a few more months to go if I’m being honest with you).
Once my manager, mentor, and I all felt pretty good about my ability to succeed in a dev role, it was time to find that role. Starting out, it was expected that I would be placed on a web team in an unbillable frontend dev position, and then transition to being fully billable. Things didn’t quite go according to plan…
~A quick aside~
As I was getting ready to leave my TE role, the manager I had since joining WT left the company. This was a bit of a downer since he had been very supportive of my goals and was the person most familiar with my work. But it didn’t turn out to be the setback I thought it might be. My new manager was equally supportive and was able to champion me because I’d taken some time to fill out my engineering rubric3 with as many things as I could remember from the past year. Keeping my engineering rubric up to date was by far the most common advice I got as I was going through this process, and it definitely helped!
~Back to the story~
Things didn’t go as planned, and instead of being put on a project right away, I was unallocated4 for a few weeks. During that time, I started looking into React Native (RN), and eventually I got put on a RN project for my first un-billable SE role. This offered me a couple of great opportunities to do development work on a client project. However, it was a short-lived glory, as the project came to an end just a couple of months after I joined. Ideally, you would be able to stay on your project for longer, do some awesome work, become billable for at least 3 months, then get that SE title. But it wasn’t meant to be, so on to the next step!
Image credit: NBCUniversal
Step 5: Leaning on Lattice
After I got off my first RN project, I continued on the RN train by joining the RN summer cohort, as the season permitted. The cohort was a group of WillowTree engineers who were in-between projects and interested in learning React Native during the summer of ‘22. We were assigned a 2-week course to get us up to speed on the framework and completed a project (a food ordering app) as part of this course. Being in the cohort provided a structured environment where I could share my progress and questions in a dedicated Slack channel, participate in bi-weekly stand-ups, and pair-program with others who were working on the same skills. Overall, it was a great chance to focus all my time on up-skilling and gaining even more development experience. After a few weeks, it placed me on the Meals on Wheels project, one of WillowTree’s low-bono client projects using RN. At this point, I had been out of the TE role for a few months, and I’d accumulated a decent amount of un-billable project experience, and – you guessed it – 🥬 feedback.
However, with allocation being unpredictable, I hadn’t gotten those 3 months of billable SE work that I needed to officially transition roles the standard way. As end-of-year evaluations were approaching, my role within WT felt uncertain. Would I get evaluated using the platform TE criteria or the SE criteria? Since I was quite far along in my transition, I was told to fill out the rubric for the role I wanted to have. So the month before end-of-year evaluations were due, I shared my updated SE rubric with my manager, who shared it with other relevant leadership. As the evidence in my rubric and Lattice was compelling enough, I was actually turned into a software engineer! With final approval from HR, my role was officially changed, and I immediately celebrated by eating a few more peanut butter cups. Although I didn’t get to this point the way I expected to, it all worked out in the end.
The bonus steps
But wait – there’s more! During my role transition, there were a few other miscellaneous things that made a difference:
Attending internal developer events, such as platform Grow sessions5, to meet and learn from fellow software engineers.
Mentoring other trees. I got to mentor two engineers during their onboarding period while I was a TE, and this was a great way to also learn about my own strengths and growth areas.
Talking to coworkers who have gone through the same role transition. Because the paths that people take towards software engineering can vary, different people may have other insights, tips, and tricks.
So that’s it, folks! All that is to say, I don’t think there’s one single path to transitioning into software engineering at WillowTree. The way someone else could approach it, and the opportunities that different projects provide could be very different. From my experience, I think it’s mostly about gaining those skills in a way that works best for you, keeping track of your successes in Lattice, and leveraging your fellow trees who can support your growth. Thanks for reading!
Image credit: Geico
Footnotes
The platform used at WillowTree for sharing peer-to-peer feedback, as well as viewing rubrics and keeping track of personal goals.
A fellow WillowTree engineer who meets with you regularly and helps you work towards your professional goals. Every engineer at WillowTree is assigned an LTM after their 90-day onboarding period.
Guides used to set standards and evaluate performance at different levels within Engineering at WillowTree. The rubrics, split into categories from Code Design & Architecture to Team Collaboration, specify what is expected of engineers at each level and are a big part of the promotion process.
Not on a client project. During unallocated time, engineers typically focus on professional development and side projects.
Weekly learning and networking opportunities, organized by team/discipline, where people can share ideas, tools, and projects, or do team bonding activities.
Mara is a Software Engineer at WillowTree, where she’s worked on React and React Native projects. In her free time, she enjoys reading, walking, and eating all the dessert.
“What does a ‘Staff Engineer’ even do?” My coworker asked, his inflection implying something I wasn’t too enthusiastic about.
I shifted uncomfortably in my seat. Not because he was being a jerk or anything — the question was asked in jest — but because he’d been working very closely with a Staff Engineer for years at this point. For the most recent several months, that Staff Engineer had been me. If he didn’t know what I did, how was I supposed to answer this? And that was the weirdest part about this: I actually didn’t know how to answer this.
30 seconds before that conversation started, I would have told you that I was super confident in my abilities, my talents, and my position here at WillowTree. Now, I was questioning everything I’d ever known about my career. Nay, questioning everything I’d ever known about life. I had to take a long walk in the mountains (I like the mountains) and consult several oracles (confused strangers) in an attempt to find myself (ironically, I got lost on a hiking trail).*
One of the biggest reasons the title of “Staff Engineer” is so hard to wrap up in one quick explanation is because it entails such a wide scope. Over the course of my time as a Staff Engineer, I’ve had responsibilities that fall into all of the following categories at one time or another:
Bugs on prod that need to be dug into
Product-wide refactors
Technical feasibility questions
Building/editing pipelines
Implementing brand new patterns or frameworks into a project
Helping maintain a project’s full test suite
Helping other devs with really off-the-wall issues
Fixing process issues or tweaking the process to get around things you can’t fix
Oh and let’s not forget about that one time a client reached out and was like “Oh hey, all of our certs expire Sunday evening can you, like, fix this?” (I probably don’t need to tell you this, but this obviously occurred on a Friday at 2:30 because when else would it have happened.)
And the list doesn’t end there. I’d argue that it’s an endless list. The main point here is that the responsibilities that land on a Staff Engineer are less a list of responsibilities and more a general comfort and skill-level with the SDLC process and with software engineering as a whole. As a Staff Engineer, you’re your team’s (or teams’, depending on your given role) go-to individual for solving the tech questions you run into as you build out your product.
Questions a Staff Engineer is expected to answer will vary wildly from week to week, not to mention from project to project. They might be problems with your project’s software. Maybe your team just discovered a technical limitation they didn’t know existed and they need you to lead the conversation in figuring out a solution, or maybe a severe production issue just reared its head and needs to be fixed yesterday. Or, they might be software problems that would crop up if you didn’t foresee them. I spent a large portion of my time on the last project working on a number of large refactors that made the codebase easier to work in for our devs. If I hadn’t done those refactors, the project would have undoubtedly gotten too complex for any human (with our squishy, human brains) to maintain. My current project is one my team and I had to build from scratch. A large part of my role in setting things up was ensuring that good practices and patterns were built into the codebase from day one. Solving problems before they become problems is always going to be far easier and cheaper than the alternative.
Sometimes, the tech questions you’ll have to answer are literal questions from the client. “What if we built the thing we told you we definitely would never need?” “What if we scrapped all of the work you just spent 3 months on and did something else instead?” “What if it’s crucial that we have some piece of functionality that you’re only just hearing about 6 months into development that isn’t going to be a quick addition?” In a perfect world, our products would be fully and perfectly defined on day 1 and would never have any of these tech questions crop up. But, as anyone who’s ever worked in tech (or, honestly, anyone who’s just tried to get their computer to do something it didn’t particularly want to do) can tell you, we don’t live in that perfect world. Constraints change (sometimes for the better, usually not). Key libraries you were hoping to lean on get deprecated. Software engineers are imperfect humans and write code with bugs. Your role, as the Staff Engineer on a project, is to make these obstacles as insignificant as possible for your team. And if the scope of potential problems is limitless, it stands to reason that your list of responsibilities and the tech you work in will also be limitless.
That might sound intimidating, but worry not! You don’t need to be the kind of “10x” engineer who needs to do everything yourself (protip: don’t be. Not only will you be much cooler to work with, you’ll also be under a lot less stress.). The good news is you aren’t the only person on your team! You’re going to be surrounded by incredibly talented engineers, each of whom has their own specific area of interest and expertise. One of the most important parts of your job is to know what you can and what you can’t delegate. Because of the nature of the position, Staff Engineers tend to bounce from one thing to another in an endless game of Staff-Engineer-Pong. Often, multiple problems will pop up at once, and it’s your job in these instances to delegate work that can be delegated. If two high-severity problems are dumped on you at once, and your team mate is an expert in the field of Problem 1, you can ask for them to take it on while you tackle Problem 2. I spent a large portion of my time in my first Staff Engineer role figuring out where I was the single point of failure and making sure other people got trained in those responsibilities. This meant that I could delegate things that popped up if the need arose. Spoiler alert: the need arose. Many times.
So as a TLDR…well, there really isn’t one, which is why I need a few whole blog posts to walk you through what it looks like to be a Staff Engineer. If you’re doing your job well, you’ll find that things like prod issues or other unexpected problems should be less common. In between those emergency issues, there will likely be things you focus on more than others. I’m hoping to get into some of those in my follow-up posts, so keep an eye out for that beautiful name (mine) that induces calm and happiness: Chris Sellek. Thanks for reading! See y’all in a bit.
* Absolutely none of this happened.
—
If this topic interests you and you want to take a deep dive into it, I want to take a moment to highly recommend the book The Staff Engineer’s Path by Tanya Reilly. Tanya does an excellent job discussing this topic in depth in her book, so go grab a copy!
Today’s blog post is the first in a series written on what the Staff Engineer role entails.
Wait, doesn’t WillowTree already have a blog? Yes, we do! And there is a ton of fantastic content on there that you should go read when you’re done here.
We wanted to create a unique outlet for our passionate engineers to quickly get ideas about new topics out to the world. Articles on topics like the ones listed below will be posted regularly to help you stay up-to-date on trends and best practices.
Mobile, Web, & OTT Frontend
Backends & APIs
Test Automation
Developing for platforms like Mulesoft & Salesforce
Emerging Technology (such as Voice, AI, and AR/VR)
Whether you are a seasoned developer or just starting out, we hope you will find value in our content.