Cypress – Use Custom Chai Language Chainers

Have you ever found yourself in test automation projects burdened with repetitive assertions on elements, constantly needing to validate their styling or behavior upon every render? With Cypress, setting up a custom command to turn a few repetitive lines into one simple command is easy. For example, on the React TodoMVC, all uncompleted Todo items can be assumed to have a standard set of CSS styling. If we decided that we needed to check the styling of every Todo item in our automated test suite, we’d have to write out the full assertion (like below) each time we wanted to assert that the CSS styling of an uncompleted Todo was correct.

cy.get('[data-testid="todo-item-label"]')
  .each(($el) => {
      cy.wrap($el)
        .should('have.css', 'padding', '15px 15px 15px 60px')
        .and('have.css', 'text-decoration', 'none solid rgb(72, 72, 72)');
	// Abbreviated assertion, but not unreasonable to have more `.and()` lines
  });

Additionally, if our styling ever changed (say, we wanted to change the text-decoration color to rgb(25, 179, 159)or no longer wanted to check the padding), we would have to update each place we used those assertions.

To save some headaches, we can instead create a Cypress custom command to handle our assertions. This reduces the amount of code written per assertion as well as the number of lines of code to change if the assertions need updating. Here is an example of using a custom command in Cypress.

// Custom Command
Cypress.Commands.add('shouldBeATodoItem', { prevSubject: true }, (subject) => {
      cy.wrap(subject)
        .should('have.css', 'padding', '15px 15px 15px 60px')
        .and('have.css', 'text-decoration', 'none solid rgb(72, 72, 72)');
    });

// Using the Custom Command
cy.get('[data-testid="todo-item-label"]')
  .each(($el) => {
      cy.wrap($el)
        .shouldBeATodoItem();
  });

This custom command makes the assertion much more compact, but the above command (cy.shouldBeATodoItem()) doesn’t look very Cypress assertion-y to me. Cypress leverages Chai for most of the assertions built into Cypress, and I think I’d prefer to utilize that same format for my custom assertions. Luckily, Chai and Cypress make it fairly easy to create custom Chai language chainers and integrate them with cy.should().

In our support file(s) (cypress/support/{e2e|component}.{js|jsx|ts|tsx}), we can reference the chai global (since Cypress comes with chai). Doing so will allow us to create our language chainers and have chai (and Cypress) automatically pick up our custom language chainers.

chai.use((_chai, utils) => {
// Custom Chainer code here!
});

I’ve found that the easiest way to create a Custom Chai Language Chainer is to use the .addProperty method.

chai.use((_chai, utils) => {
utils.addProperty(_chai.Assertion.prototype, 'todoItem', function() {
        this.assert(
            this._obj.css('padding') === '15px 15px 15px 60px' &&
            this._obj.css('text-decoration') === 'none solid rgb(72, 72, 72)',
            'expected #{this} to be a Todo Item'
        )
    })
});

Breaking the above down:

  • utils.addProperty()
    • Used to add a property to the Chai namespace
  • _chai.Assertion.prototype
    • Used to specify that the property is to be on the chai.Assertion namespace 
  • todoItem
    • Name of the language chainer
  • function()
    • Important to use a function declaration and not an arrow function since our code uses scoped this
  • this.assert()
    • Chai assertion function, using the two-parameter signature, where the first parameter is the assertion (Boolean), the second parameter is the failure message if the positive assertion fails (to.be)
  • this._obj.css()
    • this._obj is the subject of the assertion. In our cases, this will be a JQuery object yielded from Cypress, so we can use JQuery’s .css() function to find CSS values.
  • #{this}
    • The #{} syntax is used to pass in variables to Chai. This is what gets that nice printout in Cypress, where it says expected <label> to be visible

In our test, instead of our custom command, we can use our custom Chai language chainer! 

// Custom Command
cy.get('[data-testid="todo-item-label"]')
  .each(($el) => {
      cy.wrap($el)
        .shouldBeATodoItem();
  });

// Custom Chain chainer
cy.get('[data-testid="todo-item-label"]')
  .each(($el) => { 
      cy.wrap($el)
        .should('be.a.todoItem');
  });

Unfortunately, tests don’t always pass. It’s easiest to troubleshoot failing tests when the errors from the failing tests are specific to the issue, and our current implementation of the language chainer does not give us a clear picture of why our test would fail.

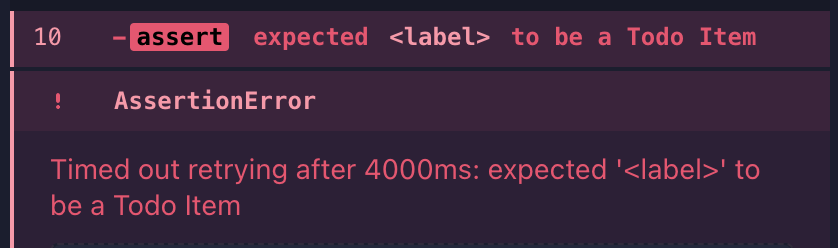
If an element doesn’t meet our assertion for a Todo Item, we don’t know why the element isn’t meeting that assertion. To get that data, the simplest way is to make a series of soft assertions. The object yielded to this._obj is static (at least per-iteration through the assertion) and can be used synchronously, so we can store our soft assertions as booleans.

// Adding Soft Assertions
utils.addProperty(_chai.Assertion.prototype, 'todoItem', function() {
        const isPaddingCorrect = this._obj.css('padding') === '15px 15px 15px 60px'
        const isTextDecorationCorrect = this._obj.css('text-decoration') === 'none solid rgb(72, 72, 72)'
        this.assert(
            isPaddingCorrect && isTextDecorationCorrect,
            'expected #{this} to be a Todo Item'
        );
    });

But that hasn’t changed our error messages yet, to do that we’ll need to change the string in the second parameter. We can manually construct our error message by checking if the soft assertion is false and, if so, adding the failure to our custom error message.

utils.addProperty(_chai.Assertion.prototype, 'todoItem', function() {
        const isPaddingCorrect = this._obj.css('padding') === '15px 15px 15px 61px'
        const isTextDecorationCorrect = this._obj.css('text-decoration') === 'none solid rgb(72, 72, 72)'
        
		let errorString = 'expected #{this} to be a Todo Item'
        if (!isPaddingCorrect) { errorString += `\n\t expected padding to be 15px 15px 15px 61px, but found ${this._obj.css('padding')}` }
        if (!isTextDecorationCorrection) { errorString += `\n\t expected text-decoration to be 'none solid rgb(72, 72, 72)', but found ${this._obj.css('text-decoration')}` }
        
		this.assert(
            isPaddingCorrect && isTextDecorationCorrect,
            errorString
        );
    });

In this example, we’ve changed the expected padding value to be 15px 15px 15px 61px, and we can see the error message displayed:

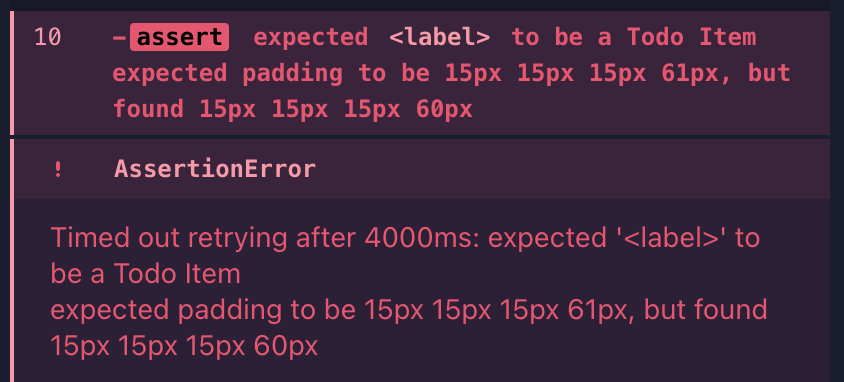
The changes accomplish our goal of being able to use a custom Chai language chainer and have an informative error message on what failed the assertion. But we’re doing repetitive tasks (iterating through some boolean values) and hardcoded values twice. We can improve our code by reusing the common values to run our soft assertions and write error messages.

// Step 1: Create an expected data object
const expected = {
            padding: '15px 15px 15px 60px',
            'text-decoration': 'none solid rgb(72, 72, 72)'
        };

// Step 2: Create a combined Soft Assertion value, using Array.every()
const hasCorrectProperties = Object.entries(expected).every(([key, value]) => this._obj.css(key) === value)

// Step 3: Use array.map() to generate our error string
this.assert(
            hasCorrectProperties,
            "expected #{this} to be a Todo Item" + Object.entries(expected).map(([key, value]) => { if (this._obj.css(key) !== value) { return `\nexpected #{this} to have ${key}: \n\t${value}, \nbut found:\n\t${this._obj.css(key)}`} else { return '' }}).join(''),
            "expected #{this} to not be a Todo Item"
        );

Breaking the above down:

The important thing to remember is that the key values for the expected data object must match the CSS properties, as we use that key value to search for the CSS property. (If we were to use the more JavaScript-like textDecoration instead of ’text-decoration’, this would not work.)

A definite improvement! But if we wanted to create several language chainers easily, we’d need to copy over the same few lines of code each time. We can abstract this to a few helper functions and simplify our setup within the utils.addProperty().

/**
 * @param {JQuery<HTMLElement>} ctx -> context, the element passed into the assertion
 * @param {object} expected -> expected data object; key is the css property, value is the expected value
 * @param {string} elementName -> name of the element being tested
 * @returns boolean, string
 */
const assertChainer = (ctx, expected, elementName) => {
    const hasCorrectProperties = Object.entries(expected).every(([key, value]) => ctx.css(key) === value);
    let positiveErrorString = `expected #{this} to be a ${elementName}\n`;
    Object.entries(expected).forEach(([key, value]) => { 
        if (ctx.css(key) !== value) { 
            positiveErrorString += `\nexpected #{this} to have ${key}: \n\t${value}, \nbut found:\n\t${ctx.css(key)}\n`;
        }
    });
    return [hasCorrectProperties, positiveErrorString];
}

// Use
chai.use((_chai, utils) => {
    utils.addProperty(_chai.Assertion.prototype, 'todoItem', function() {
        const expected = {
            padding: '15px 15px 15px 60px',
            'text-decoration': 'none solid rgb(72, 72, 72)'
        }
        this.assert(
            ...assertChainer(this._obj, expected, 'Todo Item')
        );
    })

    utils.addProperty(_chai.Assertion.prototype, 'completedTodoItem', function() {
        const expected = {
            padding: '15px 15px 15px 60px',
            'text-decoration': 'line-through solid rgb(148, 148, 148)', 
        }

        this.assert(
            ...assertChainer(this._obj, expected, 'Completed Todo Item')
        );
    });
})

(Curious about those three dots preceding assertChainer above? It uses the spread operator to turn assertChainer’s returned array into separate variables.)

Caveat:

I did not use the third parameter in these examples when constructing the custom Chai language chainers. This prevents the language chainer from accepting a negative assertion. When attempting to assert via should(‘not.be.a.todoItem’), the following assertion error is thrown, and the assertion is not attempted.

If you would like to add support for a negative error message, simply provide the error message as the third parameter in your assert() function.

Link to repo

Refactoring Our Team’s Approach to Android Automated Testing

The Goal: Code Nirvana

Imagine a world where you can release your app without lifting a finger to test it. Your code flows from your mind to your fingertips on the keyboard, then to your version control system, which triggers a set of tests, ensuring your vision is achieved without breaking any existing functionality. Some moments later, after the compilers have finished their magic, prompted by your continuous integration pipeline, a shiny, new package appears: your team’s latest creation. Something akin to “code nirvana” — the state of enlightenment, as a team of engineers, in which newly added features produced no bugs, suffering, or regressions. Sounds nice, doesn’t it?

I have been working on a team that longs to thrive in this enlightened state of code nirvana. We’re not there yet — our tests are long, bulky, and sometimes we’re not even sure what they’re supposed to test. Our pipelines — especially the emulators we try to run on them — are flaky. We use unreliable third-party systems in our tests, which leads to failures that leave us uncertain if we broke something, or if something else was broken, and we we’re merely innocent bystanders. So how do we arrive at code nirvana from this land of despair? 

Seeing the forest from the trees

For us, the first step was to take a step back and examine the current state of our tests. We noticed a few things:

A flaky emulator in our CI pipeline

This is a common issue for Android app development teams. The Android emulators run well on our hardware, but when we try to run them in the cloud, they are slow or unusable — when we can even get them to start at all. The reason is that the agents we used to run the tests don’t support full virtualization. We were trying to run our tests on virtual machines, which, in turn, don’t support full virtualization themselves. Android emulators are virtual machines, after all. 

Reliance on third-party sandbox environments

This one may be less common, but it was a real problem for us. When our tests were originally written, they were intended to be a full end-to-end test suite, triggering actual calls to the APIs we relied on, and ensuring that the integration worked properly. The problem became the reliability of those third-party systems. We were relying on real data, which was subject to change on a whim, or systems that were the sandbox environment of our partners, sometimes meaning they would be unavailable for days at a time. 

Broken tests

This one is likely another common issue and reminds me of a great article by Martin Fowler on the concept of “test cancer.” Fowler describes the problem like this: “Sometimes the tests are excluded from the build scripts, and haven’t been run in months. Sometimes the ‘tests’ are run, but a good proportion of them are commented out. Either way, our precious tests are afflicted with a nasty cancer that is time-consuming and frustrating to eradicate.” Our code was fraught with test cancer — most of our automated tests still technically ran, but their results were ignored entirely.

Unclear purpose of tests

One factor that led to our blissful ignorance of test results was that, often, we weren’t sure what they were supposed to be testing. It’s easy to ignore the result of a test if that test doesn’t provide value to your team or your client. So the tests were there, and they were running, but they weren’t telling us what we really needed to know — could our users use our app how they needed to?

Achieving enlightenment

After taking stock, it was clear that we needed to make some changes. So, like any good engineering team, we made a plan. We evaluated our problems and sought solutions that would make our tests work for us to achieve code nirvana, instead of keeping us in the land of despair.

The first problem was that we had a low confidence level in our automated tests, so manual testing was necessary for a release. In the state of code nirvana, manual testing is at a minimum. Achieving a higher level of confidence would also mean that if a test was broken, we knew we had a problem, and something needed to be fixed. Additionally, we wanted our tests to be lightning-fast, so we could immediately know whether there was an issue. Lastly, we wanted the process of adding new tests to be simple. We didn’t want to worry about whether a feature was already tested because we’d know, and we wanted to be able to add tests for untested features with a low level of effort and complexity, meaning our tests would be scalable.

To get there, we decided a few changes were in order. 

Remove tests that didn’t prove valuable

This part was relatively easy, as it mostly involved deleting a bunch of code (one of the greatest feelings in the world, IMHO). We assigned one of our test engineers to the honorable task of evaluating the tests in our automation suite against what tests we ran manually every time we did a release. The cross-section of that comparison allowed us to find the tests that actually showed us something important about our application. The other tests were dead weight, and we were happy to cut them loose. 

Lift and shift user interface validation to unit tests

When we removed our low-value tests, we found that many were trying to validate our app’s user interface. They checked that headings had the correct wording, inputs were labeled correctly, and the like. In the interest of speed and clarity, we decided to lift and shift these tests to our unit testing suite. This is one of the more involved tasks our new approach demands, but we think it will be useful. Unit tests are easier to maintain than automated tests, and it is much more useful to test different screens in isolation, where we can pass state into the views and ensure that the view is rendered correctly according to that state. It also leaves the automated tests to the task they are best suited for — to validate complete flows instead of individual views.

Run our tests using real devices in the cloud

Running our tests on real devices was one of the most important pieces for our new approach. Without a reliable way to run our tests in a pipeline, our tests would never be as useful to us as we wanted (dare I say “needed”?) them to be. Moving our automated tests to a service that provided a surefire way to run them was a necessity.

Provide fake implementations of third-party services 

The fundamental question that led us to this decision was this: what did we want our automated tests to test? At their conception, it was decided that they should be true end-to-end tests, checking our application against our third-party services, and ensuring the integration was holistically sound. Ultimately, however, we determined this approach wasn’t working for us. It was too easy to lay blame for failures on third parties, meanwhile leaving us uncertain if our work was up to par. Removing the dependency between our tests passing and our partner’s services being available, and in the state our tests expected, meant we could be certain that our work was up to the mark. 

Conclusion

We still have a way to go, and a fair amount of work to do, before we can say we’ve achieved true enlightenment, but we think we’ve formulated a solid plan, and we’re taking steps in the right direction. Ultimately, what will get us there is focusing on a small set of high-value automated tests that run reliably in our pipelines. And while the workload demanded by some aspects of our new approach will require us to get our hands dirty to make our tests healthy again, we think the outcome will be worth it. Not only will we be able to release with a smaller manual testing lift, but we’ll have confidence that the features in a release are healthy every time we have a new build. With our newfound confidence, we hope to soon leave behind the dreaded land of despair, and look forward to seeing what we can achieve next.

CI/CD is Every Engineer’s Job. Yes, Even Yours!

Picture this: the project that you’ve spent a long time working on, put in the hard hours for, and poured your soul into just releasing a new build. Sweet! But now a developer on the project pushed a brand new change and it’s your responsibility to determine if this change is good enough to be deployed to production. Time to pull that branch, open up your favorite terminal, build the application, and run some unit tests… Did they all pass? Time to run some integration tests. Did they all pass? Time to run the end-to-end tests. Oh geez, someone is bothering you on Slack too now, it’s hard to concentrate. Did those tests pass? Should I start preparing this for production deployment? Wow, this is taking a long time! Wouldn’t it be great if there was some way you could get all this done without having to do it manually? Well, I have some great news for you – you could use CI/CD for all of this!

What is CI/CD?

CI/CD (or a pipeline, as it may colloquially be known) is an automated process, or series of processes, that speed up the release of software applications to the end user. Essentially, it is automating all the manual parts of the release process that normally a developer or test engineer (TE) would do. The CI part of CI/CD stands for “Continuous Integration”, which boils down to having an automated process for code changes (often from multiple contributors). The CI will regularly build, test, and merge these changes into a shared repository like GitHub for the whole team. The CD part can stand for one of two things – “Continuous Delivery” or “Continuous Deployment”. There is a slight difference in the meaning of those two phrases. Continuous Delivery refers to a process on top of CI that will automatically have your code changes ready to deploy to an environment such as Test, Dev, UAT, etc. This means that in theory, you could decide to release whenever’s best for the project schedule. Continuous Deployment takes this process one step further by having automated releases to production. In Continuous Deployment, only a failed test or check of some kind will stop the code changes from being deployed to production once the code change is approved & merged.

How can CI/CD benefit a software project, both for Development and QA?

Everyone can benefit from CI/CD, and that’s one of the main reasons that it’s good for everyone to have some experience with it.

For developers, having CI/CD set up can improve the quality of code and the speed at which code reaches product owners and end users. With the build and deployment processes automated, the most recent changes are automatically available to other members of the project team to look at, reducing the time it takes for issues to be found. This means that TEs and product owners can take a look at the deployed version of the codebase sooner than if a developer had to do this manually since the pipeline will run each step automagically and not have to have a person sit there and watch each step until it is done. This also frees up the developer’s time to work on other tasks while the pipeline builds and deploys the changes. In addition, this can reduce the impact of code/merge conflicts since the pipeline should expose any of these issues before allowing code to reach production. Unit test failures and integration test failures in the pipeline will alert the developer early on that there are changes that need to be made to their code before deploying to production.

For the TE team, running automated tests as part of the pipeline reduces the time and effort needed to test the most recent code changes. This free time lets TEs focus on other testing scenarios such as exploratory, performance, and regression testing. It also means that the TE team will have time to write new automated tests that can be added to the pipeline. Additionally, running changes regularly through the pipeline means that TE can isolate failures to certain change sets, making it easier to diagnose and fix issues found with end-to-end automated testing.

There are also benefits to having a CI/CD pipeline that applies to everyone on the project, not just development or QA. One distinct advantage of CI/CD doing all this work for you is that it reduces human error that could otherwise be introduced in the process. At any time during the process of building the app, kicking off tests, and deploying to another environment, a person could make an error – copy/paste, typing the wrong thing, ignoring an error message – that a machine would not. A human can do things differently every time, whereas a computer will do the same thing every time. Another benefit that I touched on earlier is freeing up time that would otherwise be used to do the steps in the CI/CD pipeline manually. Developers would spend more time deploying and running unit tests, and TE would spend more time running end-to-end tests if the pipeline wasn’t there. On top of this, unless they are a miracle worker of some sort, there’s latency in between each step if a person does it, whereas a computer moves between the steps in the process instantaneously. The last benefit I’ll mention is that CI/CD can bring some good collaboration between development, QA, and other members of the project team. TEs and developers get to work together to understand each others’ processes more, which helps make sure that the pipeline is doing everything that is needed. Other members of the project leadership team may also have requirements for the pipeline that they can collaborate with the engineering team on.

How can I get started?

There are several vendors for CI/CD that you can check out, read the documentation for, and start writing. GitHub Actions and Azure DevOps are vendors that work with CI/CD and have good documentation that you can read up on before you start writing. I’ll even give you some sample steps for GitHub Actions. 

Once you’re ready to get hands-on with it, you can go to your project in your IDE, create a .github/workflows directory, and add a pipelines.yml (or whatever name you choose) file to get started with GitHub Actions. You can create several .yml files in the directory, named whatever you want, to run the various actions that you want to do. I recommend using a naming convention that makes sense i.e. nightly.yml [for running a nightly build], pr.yml [for running on opened Pull Requests], deploy.yml [for running on deploys], etc. There’s plenty of configuration that goes into your .yml file, but once you have it set up, test it to make sure that it works. The action you take to trigger said pipeline varies by how you set it up (I recommend making it on push for testing so it runs whenever you push code). Once you have it running, you can visit the GitHub page for your project and check the Actions tab to see the runs of your pipeline. (Or you can just follow the Getting Started guide from GitHub themselves 😉).

Now it’s your turn to use what you’ve learned!

Having a solid CI/CD pipeline setup is crucial to delivering a well-made, on-time project with as few defects as possible. Both QA and Development benefit from having a good pipeline on a project, so both sides need to learn about CI/CD and work together to keep the pipeline in tip-top shape. Using CI/CD allows engineers to work on other/more important tasks, ensures human error is kept to a minimum, and gets the code changes out to the stakeholders quicker. Every project should have a CI/CD setup!

Bonus

I asked ChatGPT to write me a few sentences on the importance of CI/CD in a project setting with multiple contributors in the style of a pirate and it had this to say…

“Ahoy matey! CI/CD be the wind in yer sails and the rum in yer cup when it comes to a successful project! Without it, yer ship will be dead in the water, floundering like a fish out of water. With CI/CD, yer code be tested, built, and deployed faster than ye can say “shiver me timbers!” So hoist the Jolly Roger and set a course for smooth sailing with CI/CD!”

​​How to Use Swift Snapshot Testing for XCUITest

Swift Snapshot Testing is a wonderful open source library that provides support for snapshot tests in your swift code. Its snapshot comparison options are robust, supporting UIImages, JSON, ViewControllers, and more. Originally developed with unit tests in mind, this tool is easily extended to support comparisons of `XCUIElement`s in UI tests as well. This allows for quick creation of automated tests that perform more robust visual validation than XCUI can provide out of the box.

Installing Swift Snapshot Testing

Installing involves two steps – importing the package and updating the dependency manager in your project to use the specified version.

Importing the Package (Xcode 13)

  1. Go to File -> Add Packages
  2. Click the plus and copy the Package Repository URL from the Snapshot Testing Installation Guide
  3. Load the package
  4. Select Dependency Rule and add to the project where the UI test targets live.

If the tests live in the same scheme as the application code, you’ll have to update the project settings as well. Even if they live in a different scheme, follow the steps below to ensure that the package is associated with the correct target.

Set the Package to the Correct Target

  1. Go to Project Settings
  2. Select Project and ensure that the SnapshotTesting package is displayed
  3. Select the Application Target and ensure that the SnapshotTesting package is not displayed under Link Binary with Libraries
Screenshot of xcode build phases tab showing that the package is not associated with the application target
Example: You don’t want the package to be associated with the application target, in this case SnapshotTestingExample
  1. Select the UI Test target and ensure the package is displayed under Link Binary with Libraries
Screenshot of xcode build phases tab showing that the package is associated with the UI Test target
Example: You do want the package associated with the UI test target in Project Settings, in this case SnapshotTestingExampleUITests

Using Swift Snapshot Testing

Working with snapshot testing is as simple as writing a typical test, storing an image, then asserting on that image. You’ll have to run the test twice – the first “fails” but records the reference snapshot, then the second actually validates the snapshot taken during the run matches that reference.

Writing a Snapshot Test

In the case of UI testing, without any custom extensions, you can assert on UIImages either on the screen as a whole, or on a specific element. 

Snapshot the whole screen

// Using UIImage for comparing screenshots of the simulator screen view.
let app = XCUIApplication()
// Whole screen as displayed on the simulator
let snapshotScreen = app.windows.firstMatch.screenshot().image
assertSnapshot(matching: snapshotScreen, as: .image())

Tip – Set the simulator to a default time when using whole screen snapshots

A full screen snapshot includes the clock time, which can understandably cause issues. There is a simple script you can add to the pre-run scripts for tests in the project scheme that will force a simulator to a set time to work around this.

To Set a Default Time

  1. Select the Scheme where the UI tests live
  2. Go to Product -> Scheme -> Edit Scheme
  3. Expand Test, and select Pre-Actions
  4. Hit the + at the bottom to add a new script and copy the script below
xcrun simctl --set testing status_bar booted override --time "9:41"
Screenshot of xcode the test Pre-actions settings in the scheme with run script populated with xcrun simctl --set testing status_bar booted override --time "9:41"
Simulators set to specific time when running tests

Snapshot a specific element

// Using UIImage for comparing screenshots of XCUI Elements
// Specific element on the simulator screen
let snapshotElement = app.staticTexts[“article-blurb”].screenshot().image
assertSnapshot(matching: snapshotElement, as: .image(precision: 0.98, scale: nil))

If you instead utilize the custom extension that provides support for XCUIElements directly, as found in this pull request on the repo, the code is simplified a bit and removes the need to create a screenshot manually, as seen below.

// Using extension to support direct XCUIElement Snapshot comparison
let app = XCUIApplication()

// Whole screen as displayed on the simulator
let snapshotScreen = app.windows.firstMatch
assertSnapshot(matching: snapshotScreen, as: .image())

// Specific element on the simulator screen
let snapshotElement = app.staticTexts[“article-blurb”]
assertSnapshot(matching: snapshotElement, as: .image(precision: 0.98, scale: nil))

Precision and Tolerance

One of the features I appreciate in this framework is the ability to set a precision or tolerance for the snapshot tests. As seen in some of the above examples, the precision is passed in on the `assertSnapshot()` call.

// Precision example
assertSnapshot(matching: snapshotElement, as:. image(precision: 0.98, scale: nil))

Precision is an optional value that can be set between 0-1. It defaults to 1, which requires the snapshots to be a 100% match. With the above example the two can be a 98% match and still pass.

Tip – Image size matters

While it makes sense when you think about it, it may not be readily apparent that you need to have two images of the same height and width. If they differ in overall size, the assertion will fail immediately without doing the pixel by pixel comparison.

Tip – Device & machine matters

Snapshots need to be taken on the same device, os, scale and gamut as the one it will be run against. Different devices/os may have differences in color, and my team even saw issues where the same simulator, os, and xcode version had snapshots of a slightly different size when generated on two different developer machines of same make and model – but were different years and slightly different screen sizes.

Reference Snapshots

As mentioned, reference snapshots are recorded on the first run of the test. On subsequent runs, the reference snapshot will be used to compare against new runs. If the elements change, it is easy to update them.

Snapshot Reference Storage Location

The snapshot references are stored in a hidden `__Snapshots__` folder that lives in the same folder in which the snapshot assertion was called. 

For example, if my file directory looks like this:

Screenshot showing the file directory for UI Tess, with the subfolders of Screens and Test with additional subfolders and files.

If the functions that call `assertSnapshot` live in the `BaseTest.swift` file, the `__Snapshots__` folder will also exist under `Tests`. The snapshots themselves are then sorted into folders based on the class that called them.

Screenshot showing the folder structure generated for the snapshots and an example of how the screenshots are labeled.
Example: Finder view of the folder structure showing a full screen snapshot taken from a test found in the BaseTest class.

The snapshots will be named according to a pattern, depending on if they are full screen or specific element snapshots:

  • Specific Element: <functionCallingAssertion>._<snapshotted element>.png
  • Full Screen: <functionCallingAssertion>.<#>.png
// Take snapshot of specific element
func snapshotElement() {
  let homeScreenLoginField = app.textFields[“login-field”]
  assertSnapshot(matching: homeScreenLoginField, as: .image())
}

// Take snapshot of whole screen
Func snapshotScreen() {
  let screenView = app.windows.firstMatch
  assertSnapshot(matching: screenView, as: .image())
}

Given the examples above, the file names resulting of each would be:

  • Specific Element: snapshotElement._homeScreenLoginField.png
  • Whole Screen: snapshotScreen.1.png

Update Snapshots

There are two ways to update snapshots with this tool – with a global flag or a parameterized flag. 

// Pass in update parameter
assertSnapshot(matching: someXCUIElement, as: .image, record: true)

// global
isRecording = true
assertSnapshot(matching: someXCUIElement, as: .image)

For the project where we implemented snapshot testing, we utilized the global flag to allow for snapshots to be generated in CI; otherwise, we used the parameterized variant for updating specific test/device combinations. 

Tip – Tests With Multiple Assertions

Consider carefully if you are thinking about having multiple snapshot assertions in a single test. This is not something I would recommend, largely based on the difficulty of updating the reference snapshots.

One hiccup we ran into with using snapshots was attempting to update them when a test had multiple `assertSnapshot()` calls. If you use the parameterized flag, the test will always stop at the first assertion where that flag is active to make the recording. Then you have to toggle it off, run it again for the next one and so on. 

This behavior is worse if you use the global flag, as once it hits the first assertion it will stop the test to take the screenshot, and never continue to the other assertions.

Snapshots on multiple devices

With this framework, you can simulate multiple device types on a single simulator by default. However if you find the need to run a full suite of tests on multiple simulators, you’ll need to extend the code to provide a way to do that – otherwise any simulator aside from the one that the reference shots were taken on will fail.

Resolving this on our team was actually pretty easy – my teammate Josh Haines simply overloaded the `assertSnapshot()` call to pass in the device and OS versions to the end of the file name so that it always checks the snapshot associated with a specific device.

/// Overload of the `assertSnapshot` function included in `SnapshotTesting` library.
/// This will append the device name and OS version to the end of the generated images.
func assertSnapshot<Value, Format>(
  matching value: @autoclosure () throws -> Value,
  as snapshotting: Snapshotting<Value, Format>,
  named name: String? = nil,
  record recording: Bool = false,
  timeout: TimeInterval = 5,
  file: StaticString = #file,
  testName: String = #function,
  line: UInt = #line
  ) {
  // Name will either be "{name}-{deviceName}" or "{deviceName}" if name is nil.
  let device = UIDevice.current
  let deviceName = [device.name, device.systemName, device.systemVersion].joined(separator: " ")
  let name = name
    .map { $0 + "-\(deviceName)" }
    ?? "\(deviceName)"
  
  SnapshotTesting.assertSnapshot(
    matching: try value(),
    as: snapshotting,
    named: name,
    record: recording,
    timeout: timeout,
    file: file,
    testName: testName,
    line: line
  )
}

The end results of this is an updated file name based on the simulator it’s taken on: <functionCalling>._<snapshotElement>-<device name>-<OS version>.png

For example, something like `testSnapshotTesting._snapshotElement-iPad-Pro-12-9-inch-5th-generation-iOS-15-5.png`

Triaging Failures

When a snapshot test fails, three snapshots are generated: reference, failure, and difference. Difference shows the reference and failure shots layered over the top of each other highlighting the areas where pixels differ. In order to see these snapshots, you need to dig into the Test Report and look at the entry right before the test failure message.

Viewing Snapshot Failures

  1. In a local run, right click on the test that has failed and select `jump to report`. In a CI run, download and open the .xcresult file in Xcode.
  2. Expand the test to see the execution details
  3. Expand the “Attached Failure Diff” section (found right before the failure)
Screenshot of the .xcresult file report for a failed test run where you can find the diff between the expected and actual snapshots
Example: Where to find the snapshots to triage for failures

When looking at the `difference` image, you’ll see the overlay of reference over failure to show where discrepancies are. It can be difficult to parse, but if you look at the example below, the white parts are roughly where the pixels differ while the matches are dark. 

Screenshot of a section of the diff showing the overlay of two different times from the simulator clock
Example: The difference image showing the diff of the simulator clock

Check Swift Snapshot Testing’s GitHub repo, or get a tour of it from its creators in some unit tests at their website, pointfree.co.